“All through time, people have basically acted and re-acted the same way in the market as a result of: greed, fear, ignorance, and hope – that is why the numerical formations and patterns recur on a constant basis” – Jesse Livermore
Jesse Livermore says it better than me and he is a big part of the reason why I study chart patterns so intensely. Stock charts organize human behavior in patterns that allow us to anticipate future moves based on past results. Based on this assumption, I wrote a post last October titled: Is Shanghai a Nasdaq Déjà vu
I compared the 1929 Dow Jones to the 2000 NASDAQ (as many have before me) and then the 2000 NASDAQ to the 2007 Shanghai Composite Index. The three looked so eerily similar that I knew I had to write an intense post with excellent graphics to back up the possibilities. The entire post is pasted below or can be found on the link above. This is what I had to say about the future developments of the Shanghai Composite Index based on my studies of 2000 and 1929:
This won’t happen overnight but human nature always repeats so expect a huge decline in the Shanghai Stock Exchange within the next several years.
“The price pattern reminds you that every movement of importance is but a repetition of similar price movements, that just as soon as you familiarize yourself with the actions of the past, you will be able to anticipate and act correctly and profitably upon forthcoming movements” – Jesse Livermore
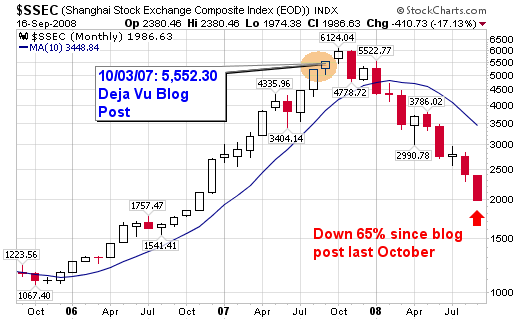
Well, take a look at what has happened to the Shanghai markets since my post last October: The chart has dropped in almost an exact shape and slope as did the NASDAQ in 2001 and 2002. The index is now down more than 65% since my blog post and more than 70% since its peak.
The moral of this post (I’ll leave it to Livermore one last time):
“Wall Street never changes, the pockets change, the stocks change, but Wall Street never changes, because human nature never changes” – Jesse Livermore.
Take a look at the charts from 2007 and compare them to the charts above. Human nature!
*************October 3, 2007 Blog Post*************
The rise of NASDAQ in the late 1990’s has been compared to the rise of the Dow of the late 1920’s. Chart overlays are amazingly similar.
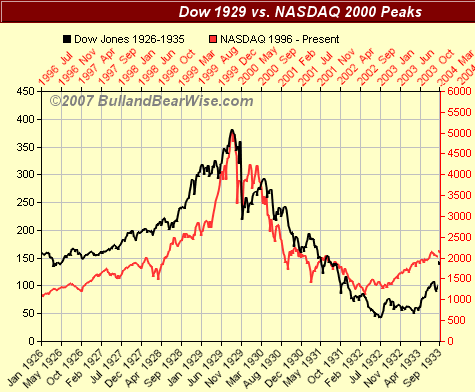
Image from BullandBearWise.com
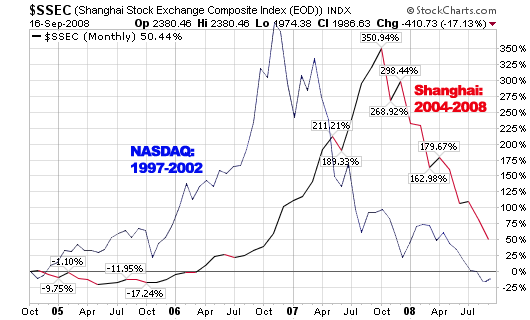
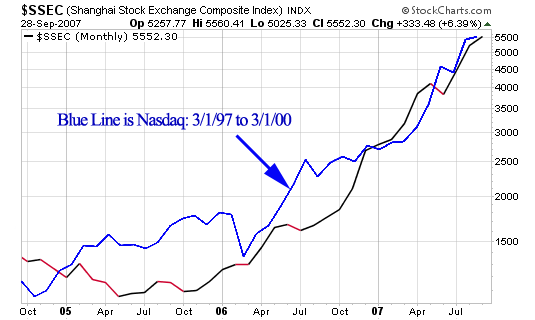
Well, the current two year rise of the Shanghai Stock Exchange Composite Index looks remarkably similar to the rise of the NASDAQ of the late 1990’s and the charts below explain better than I can!

The NASDAQ rose from 1,250 to 5,132 from March 1997 to March 2000: 310% gain!
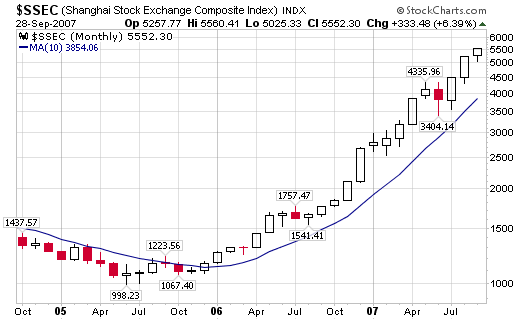
The Shanghai Stock Exchange has moved from 998.23 in June 2005 to 5,552.30 today (10/2/07): 456% gain!
As you can see, the blue line of the late 1990’s NASDAQ has moved meticulously with the Shanghai Index of today.
Will the Shanghai Stock Exchange end up with the same result as the NASDAQ of the late 1990’s. As you can see, the NASDAQ went from 1,250 to 5,132 back down to 1,192 (all within a five year period).
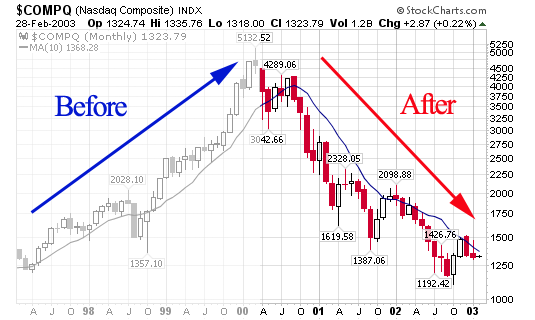
This won’t happen overnight but human nature always repeats so expect a huge decline in the Shanghai Stock Exchange within the next several years.
1929, 1999, 2007, etc…
***************************************


Nice analysis! This was what I was talking about!
Do you take requests? if not then can ignore this!
Else
I was wondering if you can have a look at Indian index NIFTY?
You should throw in the Japanese deflation of the 80s too. If you want to see what our economy will probably look like with all of this government intervention take a look at how long that deflationary period lasted.
Very interesting. Thanks for that.
Andy
love this stuff
any oher charts exhibiting parabolic moves lately ie oil, gold, etc?