Short Term Oversold

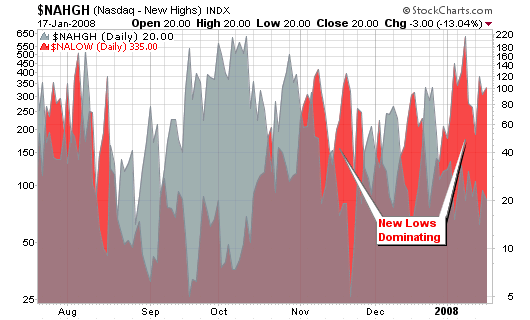
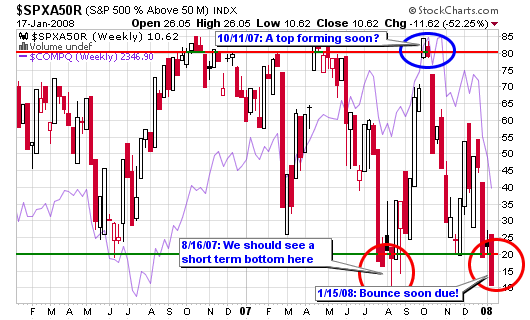
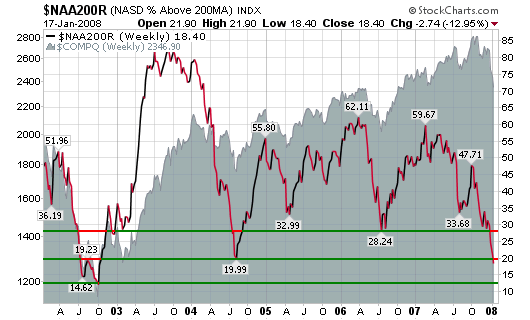
The market is oversold short term. Can it go lower? Of Course!

I am looking to take my first “long position” in YGE if the market bounces in this position. Below is my trade setup from January 8, 2008 when the stock was trading at $32.24. It closed at $25.17 yesterday.

Potential Trade Set-up:
Ideal Entry: $25.00
Risk is set at 1.0% of total portfolio or $1,000 of $100k
Stop Loss is 10% or $22.50
Number of Shares: 400
Position Size is $10,000
Risk is $2.50
Target is $44.00 (based on former peaks and bottoms)
Reward-to-Risk is 7.6-to-1 with ideal entry; less with current price

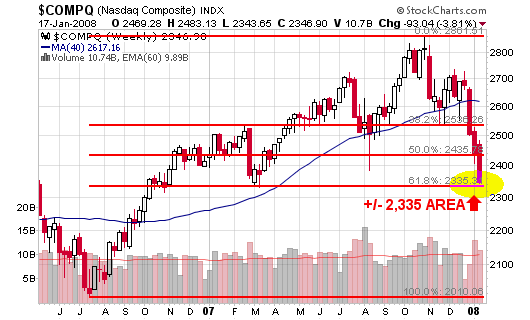
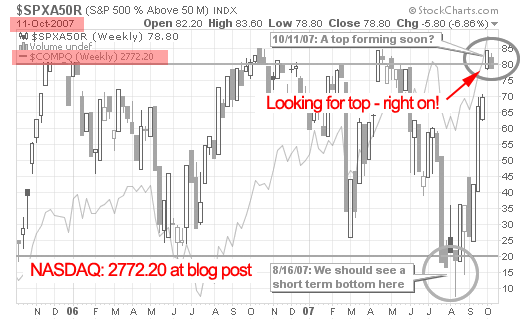
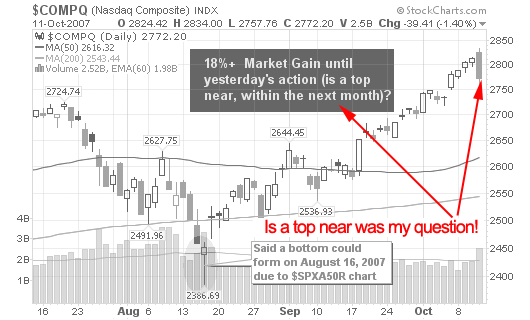
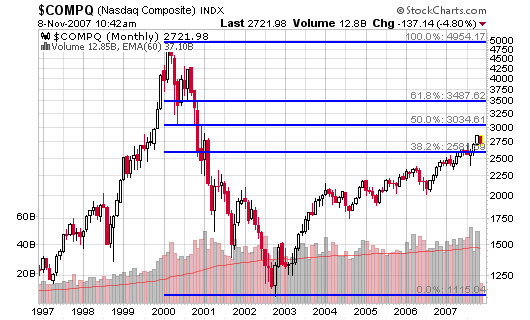
The first chart shows the NASDAQ filling my yellow gap within one day; the next stop looks to be 2,200 if it keeps falling.

011708_nas_fib.png

011708_nas_nhnl.png

011708_snp_above50d.png

011708_nas_above200d.png

[Read more…]

Charts Called the Top in October

The charts clearly called the top of this market in October 2007 and did so with great accuracy. The NASDAQ was flashing multiple distribution days as you can see from the blog posts I made three months ago. You can view the original color charts through the links provided but I am including them here as grayscale images. I wrote about a possible top on several occasions in October but the market leaders continued to move higher so we kept trading the trend.

Bottom line – the warning signs were there, we talked about selling the red flags and it all came to fruition.

The chart tracking the number of stocks on the S&P 500 that are trading above their 50-day moving average has been extremely accurate. It is now starting to call for an intermediate bounce to the upside as the index flirts with the oversold 20 area (see color charts below).

Distribution Day #1: October 12, 2007

The number of stocks above their 50-day moving averages crossed above the overbought level of 80 last week and we saw our first major sell-off distribution day yesterday. This doesn’t mean you must rush today to sell all of your holdings but do understand that the next sell-off is not far from happening. Study the chart below and follow the purple line to see where and when the market had peaks and valleys as related to the number of stocks on the S&P 500 above or below their respective 50-day moving averages.

This is only a secondary indicator but one of the most reliable while trying to look for clues to a short term market top and/or bottom. I have come to realize that the bottom signals have been more accurate than the topping signals over the past several years!

011508_nas_oct_nhnl.png

The markets flashed a heavy distribution day Thursday as the NASDAQ was down 1.4% on volume 60% larger than the previous day. This was the largest showing of volume in two months and is not healthy because it was pure distribution. It was only the second distribution day over the past month so we can’t call this a bear run but please be on the lookout for a possible correction of 5%-10%. Technology stocks led the decline as BIDU gave back 10% of its amazing run.

Second Major Distribution Day, October 20, 2007

We witnessed our second major distribution day as the DOW was down 2.6% on volume 40% larger than the prior trading day. The NASDAQ was down 2.6% on volume 15% larger than Thursday.

It was the worst selloff for the NASDAQ since February and the largest for the DOW since August. Volume surged across all major indexes but do keep in mind that it was options expiration day.

Technically speaking, we now have 4 distribution days for the NASDAQ and 3 for the DOW over the past month. It’s now time to start focusing big-time on the market leaders to see where they are going to take this market. If they start to roll over, you better be quick to take profits and even quicker to take losses.

011508_nas_oct_top.png

What are the charts saying today?

[Read more…]

Extreme New High – New Low Readings

The New Year started by giving the market the third lowest NH-NL Ratio rating since the start of 2007 with an adjusted average of -83%. Only the weeks ending on Saturday, November 24, 2007 (-84%) and Saturday, August 18, 2007 (-87% – the lowest in more than 5 years) were weaker. In contrast, 2006 ended on a positive note and extended its run with a decent opening in 2007; the prior New Year (05-06) did much of the same. (Complete NH-NL Data is at the bottom of this post)

We have not had a bullish reading (as noted in the legend on the chart – click for full view) since the week ending on Saturday, June 2, 2007. Last year (2007) ended with only half as many “very bullish” weeks as we witnessed in 2006.

*click the image for a larger view*

010908_nh_nl_sm.png

New lows topped 3,000 for the first time in many years during the week ending Saturday, November 10, 2007. This is the first reading of this type that I can find dating back to the 2002 data that I have stored on my computer.

The market gave us exactly 1,000 new lows last Friday, only the third time we reached or topped this number over the past couple of years.

So, what does all this confusing NH-NL Ratio data mean?

Well, the data of the past has actually guided us in and out of the market while it was trending but I have also noticed how the extremes have come precisely when the market is looking to reverse and move in the opposite direction. We have been getting many extremes over the past few weeks and months (including last Friday).

Are the current extreme levels telling us that this market has a bounce coming?

According to the charts, it does. We should see some type of a bounce considering that the NASDAQ reversed nicely to close the day Wednesday and the fact that other indicators are pointing for a reversal as well. The NASDAQ is at the lower end of its Bollinger Bands as shown on a chart below (the green band).

010908_nas_bb.png

The market bottomed the last time I made a significant post about the NH-NL Ratio on August, 21, 2007 is a thread titled: New High New Low Ratio Sets New Low

Historical chart (1968-2007) here for the Lowest Hi-Low Differential in Nine Years

[Read more…]

Mid December January Effect

Why do you invest your hard earned cash in the stock market? Ask yourself this question. Please think carefully and truthfully; now write down your answer before you continue reading.

Is it for retirement, for income, for real estate, your kid’s education, etc.?

Whatever the reason, I am sure most of you have developed a set of rules to follow before dumping thousands of dollars into the market.

If not, how do you know when to buy and sell without a documented set of rules based on a proven strategy? Under what circumstances do you buy and sell? What are the criteria that you use to make those final decisions that will affect you and your family? Do you even know what position sizing and expectancy are?

Anyway, according to the Stock Trader’s Almanac, the January Effect now takes place during mid-December. Many publications and stock market “gurus” will be talking about the January effect and how you may profit from the cyclical trends that supposedly exist.

From Wikipedia, the free encyclopedia:

The January effect (sometimes called “year-end effect”) is a calendar effect wherein stocks, especially small-cap stocks, have historically tended to rise markedly in price during the period starting on the last day of December and ending on the fifth trading day of January. This effect is owed to year-end selling to create tax losses, recognize capital gains, effect portfolio window dressing, or raise holiday cash. Because such selling depresses the stocks but has nothing to do with their fundamental worth, bargain hunters quickly buy in, causing the January rally.

The point of this article is to remind my readers to steer clear of the hype behind so called special situations that don’t play into your developed trading system that was designed to fit with your personality and emotions. Some talking heads may try to convince you to buy beaten down shares in companies that will bounce in the first two weeks of the year based on historical cycles. I see too many people jump at the opportunity to change their investing beliefs because some guy on the other end of computer wrote an article claiming to make you lots of money over the final two weeks of this year and the first two weeks of the year.

Instead of wasting your time studying theoretical bounces that may or may not occur, take the time to review last year’s trades and document the positive and negative aspects of your portfolio.

  • Exude your metal strength and trading conditioning while ignoring the noise coming from different directions.
  • Study your best trades and understand why they were the best trades.
  • Analyze your losing trades and understand where you made the mistake.
  • Correct those mistakes in the coming year and understand if the losing trade was the right move.
  • Sometimes losing trades were placed properly but the investment just didn’t work out as expected. That’s life in this game!
  • Be honest with yourself and highlight the areas that need work and continue to polish your strengths.
  • Don’t abandon what is working because a talking head on television tells you his system works in only 15 minutes per day, two days per month.

You could always forgo the hard work of developing your own screens each night so you can save time by buying and selling the red and green arrows on the systems of late night television.

Stick to one system that works and try to consolidate the strongest features of that system to your advantage and ignore the hundreds of other systems and indicators that can be found on every investing web site on the net. Understand that you will modify this system over time as the markets evolve. Certain indicators, patterns and setups will work differently at different times so you must understand how to compensate for these changes in nature. It is a possibility that these changes allow some to believe in the January Effect but I chose to ignore it and focus on what I am doing.

Stay focused in the New Year, start fresh and think positive! Instead of reading 100 books on 80 different trading systems, reread a few essential books that focus on the style of investing that best suits your trading.

Market Corrections, Bears and the Big Picture

Market Corrections:
Market corrections are healthy as they allow advancing stocks to take a step back and breathe. Corrections of 5%-10% allow the leading stocks to shake out all weak holders while setting up support levels and sometimes new base formations. Humans (traders) are typically sheep so they pile in at the top and run for the doors at the bottom. Don’t follow the crowd, so don’t panic during a market correction.

110807_nas_mnthly.png

Look at the overall BIG PICTURE before making major decisions on a short term intraday or daily chart.

Even weekly charts can fake you out when you start to see red across your portfolio screen (during a large market correction).

Market corrections and flat markets allow intelligent investors to study conditions carefully while they sit on the sideline patiently awaiting the defining trend. Money is made on the big moves, not the minor day to day moves. Corrections allow big moves to establish themselves.

Don’t go crazy over the minor day to day moves! Look at the BIG PICTURE!

110807_dow_mnthly.png

As for Bear Markets:

  • Keep in mind that nearly 75% of all stocks follow the general market trend
  • Your cash doesn’t need to be committed to the market at all times. This philosophy is suited to making the most money in bull markets or markets trending higher
  • It is psychologically and emotionally healthy to get out of the market from time to time, especially after a losing streak
  • It is essential to keep up your watch lists during bear markets and/or general market corrections as many present and future leading stocks are building new bases
  • Stocks that correct the least and display the highest relative strength ratings tend to be the leaders of the next up-trend or bull market. Take note of all stocks that are base building during corrections; a cup with handle, flat base or major moving average support.

110807_nas_fib.png

Signs pointing towards a correction or bear market:

  • The major indexes will advance on below average volume
  • Stocks making new 52-week highs will be limited
  • Stocks making new lows will increase
  • Major indexes will fall below the 50-day MA and/or the 200-day MA
  • Index averages will start to under perform. Relative strength lines will head south
  • Major publications will tout hot stocks at key market reversals (market tops)
  • Institutional (smart money) will bail on huge volume
  • General market index down days on excessive volume (always above average)