Sell Rosh Hashanah, Buy Yom Kippur

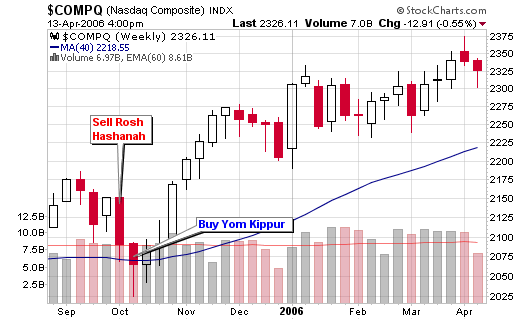
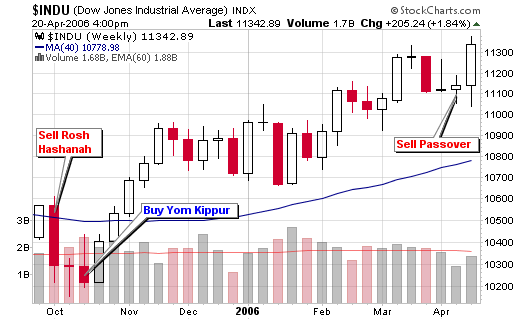
History tells us to sell this Thursday (September 13, 2007) due to the Rosh Hashanah holiday. It then tells us to buy next Friday (September 21, 2007) when Yom Kippur begins.

Before you follow this advice blindly; I would like to explain that I am having some fun to open the week with some statistics from the Stock Trader’s Almanac. I don’t necessarily buy and sell based on these holiday patterns (and you shouldn’t either) but I like to note and highlight them on the blog from time to time.

The belief is that many traders and investors sell during busy religious observances and focus on their families and faith instead. With this in mind, the Almanac notes that positions are closed out, volume fades and a buying vacuum is created.

091007_nas_rosh_05.png

What makes these holidays special is the fact that they fall in September or October each year, two very volatile and opportune months. September is the biggest losing month for the DOW and S&P 500 since 1950 (the NASDAQ as well, since 1971). The three have a cumulative total loss of (57.7%), (37.6%) and (34.7%) respectively. The DOW has had 20 up-months and 36 down-months while the S&P 500 has had 23 up-months and 33 down-months during the period from 1950 to 2006. October has given the three indexes a total cumulative gain of 30.4%, 48.9% and 18.5% respectively. This helps to explain the success of the religious buys and sells.

September tends to open strong but then closes weak due to end-of-quarter mutual fund portfolio restructuring and many investors getting back into the swing of things after summer vacations, kids back in school and new business years (fiscal).

091007_dow_rosh_05.png

Religious Holiday Data:
The Dow Jones Industrial Index has been down 20 of the past 35 years from Rosh Hashanah to Yom Kippur and up 24 of the 35 years from Yom Kippur to Passover. The average loss starting on Rosh Hashanah is (0.4%) and the average gain is 7.1% after Yom Kippur. Seven of the past eight years have given us negative readings starting on Rosh Hashanah while 14 of the past 16 years have shown positive gains from Yom Kippur to Passover. The DOW has gained an average of 9.1% over the past 16 years from Yom Kippur to Passover with the 1998-99 period topping the list at 25.4%.

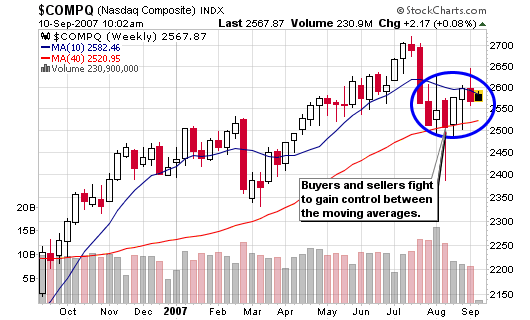
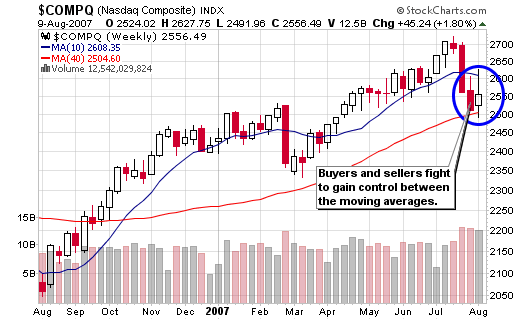
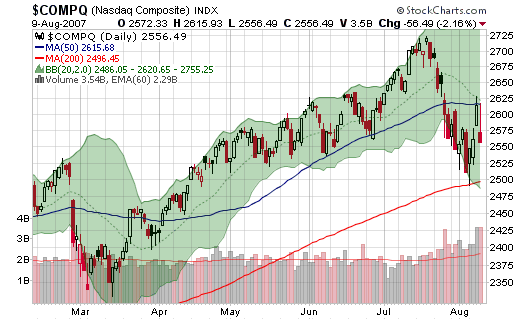
I leave you with this quote and the current chart of the Nasdaq:

“Major Bottoms are usually made when analysts cut their earnings estimates and companies report earnings which are below expectations.”

– Edward Babbitt, Jr.

091007_nas_wkly.png

Gone away for the Summer? It’s Time to Come Back

“The financial world encourages investments in the November through April period more so than in the May through October period.” according to Elizabeth Thompson’s article Gone away for the Summer? It’s Time to Come Back.

Many of you are familiar with the statement:
“Sell in May and go away”

082907_halloween.png

Mrs. Thompson goes on to say that January is the month that employees sign up for 401(k) plans while IRA’s have an April deadline which requires investors to place more money in their stock related retirement funds. This type of setup brings an influx of money to the table during the beginning of each year and naturally pushed prices higher before the flat summer months when they typically correct.

082907_pumpkin.PNG

September is historically one of the worst performing months in American stock market history but it can also present an ideal opportunity to place positions on stocks that are showing excellent relative strength. Typically, these stocks go on to be market leaders and breakout after Halloween and into the New Year. Some say that the market has a very distinct seasonal pattern, one that was popularized as the “Halloween Indicator”, directly relating to the quote above.

November through February are some of the best performing months according to the Stock Trader’s Almanac but if you wait to place positions at the end of this time period, you may be buying extended leaders.

Another historical study suggests that the market will continue to trade the way it has traded for the first five months of the year. If this scenario holds true in 2007, we should trade higher to close the year.

With Labor Day upon us, many across the US will be greeted with the end of the summer and the final days of vacation for most major institutional traders, managers and players.

I now leave you with some data from the Stock Trader’s Almanac:
If an investor invested $10,000 in the DJIA on November 1 and sold on April 30 every year from 1950 to 2004, they would have earned $492,060. If this same investor did the opposite and had bought on May 1 and sold on October 31 from 1950 to 2004, a $318 loss would have resulted. That is an amazing stat, one that is difficult to fathom. This trend extends outside of the American stock market as an article from December 2002 of the American Economic Review says that such a statistical pattern existed in the U.K. stock market as far back as 1694 and still exists today.

Enjoy the long Labor Day holiday!
082907_flag.jpg

Two Months of Warnings

If you follow this blog, you were PROTECTED!

The posts below show detailed analysis and warnings over the past two months of the current correction we are experiencing. Do NOT blame anyone but yourself if your stocks are sitting there getting slaughtered over the past couple of weeks.

Eugene D. Brody was Right:
“Sell stocks whenever the market is 30% higher over a year ago”

Ice Cold Hype! August 10, 2007

“This type of action is clearly an indicator of buyers and sellers struggling to gain the upper hand. I won’t be the one to predict which group will win but I can tell you that I currently hold two long positions and one short position heading into tomorrow. So I guess I am playing both sides of the fence. I like my short heading into morning trading.”

Don’t Believe the Hype! August 7, 2007
Sorry to tell you but it was all Hype by the media, including my favorite: IBD!

“IBD states that the recent market lows failed to undercut the previous low which makes the follow-through viable but I am not buying it. Financial and insurance stocks led the markets higher Monday; not the ideal groups to lead a rally.”

We took out the 200-day moving average!

“It will be interesting to see if the NASDAQ can hold the 200-day moving average and if it does, none of this research matters right now. However, a violation of the line is only a confirmation that this market wants to correct 15% or more.”

A Negative New High – New Low Ratio (NH-NL) August 2, 2007

“Could the NH-NL ratio be marking the beginning and the end of the strong run from 2006 to 2007?”

“So what does this all mean?
It means that the market should be ready to correct by 10% based on the history of my NH-NL studies.”

Taking Partial Profits July 19, 2007
I started taking profits just as the market reached a top – based on my technical indicators!

It’s the summer and volume is typically quiet and profits have been very handsome in 2007 so I started to sell shares yesterday in JASO. After doing my research last night, I have decided to take down at least half my position in four other holdings:
BIDU, EDU, LOOP and MA

NASDAQ Stocks show Moving Average Divergence July 2, 2007

“Another secondary indicator is pointing to an exhausted market that is due for a correction or pullback but please understand that this is only a secondary indicator.”

“It tells me that the weaker stocks are starting to drop below their 50-day moving average support level which indicates that the market leaders and general market may soon follow.”

Don’t be Greedy June 19, 2007

“I have talked numerous times about the market moving 30% higher than it was last year and how this is a warning of a pending correction in the near future.”

“I can’t stress enough how you must protect your profits when the general market is up 30% over its levels from last year. Set hard physical stops and don’t chase extended stocks even if they have excellent fundamental and technical characteristics.”

Click through or scroll down to see the updated charts that I used in these original posts!
[Read more…]

Ice Cold Hype!

I told everyone “Don’t Believe the Hype” after Monday’s market and this thinking may be coming to fruition. I don’t want to jump the gun on any predictions but that blog post stirred up more interest than any post I have ever written.

Today’s IBD “Big Picture” Section reads:
“Credit Crunch Fuels Sell-Off, Casts Doubt On Rally”

They mention that the rally, which was confirmed earlier in the week, is now skating on thin ice and is under pressure. To me, the follow-through was already on thin ice based on Monday’s NH-NL ratio; it has now cracked and may be falling through.

Anyway, enough of the shots at IBD because I still view it as one of the best stock market papers on the newsstand.

The NH-NL ratio currently sits at 168-524 or a negative 51.43% for the week (a stronger reading than the past two weeks).

Here is a look at the past three weeks:
07/28/07: 142-572, -60.34%
08/04/07: 85-529, -72.43%
08/11/07: 168-524, -51.43% (not including Friday)

For the complete list, please see this post: NH-NL Ratio.

What a difference a day makes for Headlines (The Media are Sheep):
081007_drudge.png

Looking at the action on the NASDAQ and DOW, we can see how the indices are struggling to recover the 50-day moving average while bouncing above the 200-day moving average.

081007_nas_wkly.png

This type of action is clearly an indicator of buyers and sellers struggling to gain the upper hand. I won’t be the one to predict which group will win but I can tell you that I currently hold two long positions and one short position heading into tomorrow. So I guess I am playing both sides of the fence. I like my short heading into morning trading.

081007_nas_daily.png

Either way, continue to monitor the recent market leaders and take the trades based on the setups and try not to form an opinion of where you THINK the market is headed. Just follow the market in the direction it wants to take. Sounds simple enough, now execute!

081007_nh_nl.png

Don’t Believe the Hype!

Investor’s Business Daily labeled today’s “Big Picture” Section:
“Dow Follows Through As Stocks Rebound On Volume”

Really? Which stocks lead this rebound?

The New High- New Low Ratio (NH-NL) closed at 77-1,003 on Monday, the weakest reading in five years (according to my data). The reading registered at (85.74%); yes, a negative 86%! Outside of the past two weeks, Monday’s new low daily reading was larger than any one weekly reading since August of last year. One day’s total new lows surpassed five days of lows of every week over the past twelve months (now that is telling us something).

The only lower reading that I can find over the past several years comes to us from May 10, 2004 when the ratio closed at 23-674 for a (93.40%) percentage reading. As you can see from the chart, that reading came when the market made an intermediate low and then bounced higher for a few weeks. Shortly after, the market dropped by 15% before staging another rally later that year.

080707_nas_04.png

IBD states that the recent market lows failed to undercut the previous low which makes the follow-through viable but I am not buying it. Financial and insurance stocks led the markets higher Monday; not the ideal groups to lead a rally.

More than 150 banking stocks made new lows Monday with the real estate group in a distance second with 66 new lows. Retail, medical and finance stocks rounded out the top five industry groups making the most new lows.

The total number of stocks making new lows during the week of March 10, 2007 was 727 (for all five days). That was the largest number of new lows in one week prior to July (late July averaged 2,700+ new lows per week). The correction in February was short lived and leading stocks were still near new highs and several of them continued to make new 52-week highs. The current environment looks different as leading stocks are breaking down and new lows are reaching extreme levels.

It will be interesting to see if the NASDAQ can hold the 200-day moving average and if it does, none of this research matters right now. However, a violation of the line is only a confirmation that this market wants to correct 15% or more.

080707_nas_wkly.png

Finally, 10 of the top 10 largest new lows happening in one day have all occurred over the past three weeks:
1. 1,003
2. 939
3. 744
4. 677
5. 580
6. 561
7. 560
8. 551
9. 345
10. 300

The largest one day drop this year, prior to July 2007 came on March 5, 2007 with a tiny 298 reading (doesn’t even make the top 10). The largest one day new lows reading of last year came on July 14, 2006 at 455 (this would only be number 9 on our list above).

Could this be a contrary indicator showing us a market bottom as it did in 2006? I don’t think so based on other market data and individual stock action.

Anyway, be careful and don’t drink the kool-aid because the new lows paint a completely different picture than the indices or the media!