Investor’s Business Daily labeled today’s “Big Picture” Section:
“Dow Follows Through As Stocks Rebound On Volume”
Really? Which stocks lead this rebound?
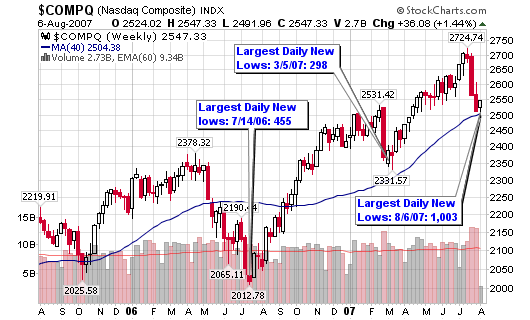
The New High- New Low Ratio (NH-NL) closed at 77-1,003 on Monday, the weakest reading in five years (according to my data). The reading registered at (85.74%); yes, a negative 86%! Outside of the past two weeks, Monday’s new low daily reading was larger than any one weekly reading since August of last year. One day’s total new lows surpassed five days of lows of every week over the past twelve months (now that is telling us something).
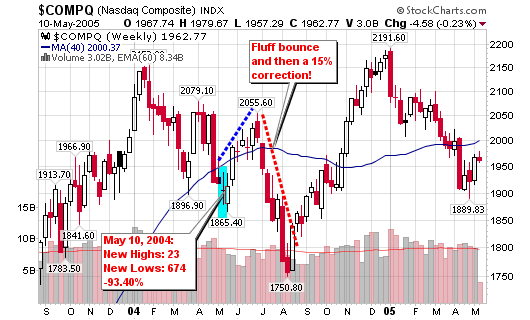
The only lower reading that I can find over the past several years comes to us from May 10, 2004 when the ratio closed at 23-674 for a (93.40%) percentage reading. As you can see from the chart, that reading came when the market made an intermediate low and then bounced higher for a few weeks. Shortly after, the market dropped by 15% before staging another rally later that year.
IBD states that the recent market lows failed to undercut the previous low which makes the follow-through viable but I am not buying it. Financial and insurance stocks led the markets higher Monday; not the ideal groups to lead a rally.
More than 150 banking stocks made new lows Monday with the real estate group in a distance second with 66 new lows. Retail, medical and finance stocks rounded out the top five industry groups making the most new lows.
The total number of stocks making new lows during the week of March 10, 2007 was 727 (for all five days). That was the largest number of new lows in one week prior to July (late July averaged 2,700+ new lows per week). The correction in February was short lived and leading stocks were still near new highs and several of them continued to make new 52-week highs. The current environment looks different as leading stocks are breaking down and new lows are reaching extreme levels.
It will be interesting to see if the NASDAQ can hold the 200-day moving average and if it does, none of this research matters right now. However, a violation of the line is only a confirmation that this market wants to correct 15% or more.
Finally, 10 of the top 10 largest new lows happening in one day have all occurred over the past three weeks:
1. 1,003
2. 939
3. 744
4. 677
5. 580
6. 561
7. 560
8. 551
9. 345
10. 300
The largest one day drop this year, prior to July 2007 came on March 5, 2007 with a tiny 298 reading (doesn’t even make the top 10). The largest one day new lows reading of last year came on July 14, 2006 at 455 (this would only be number 9 on our list above).
Could this be a contrary indicator showing us a market bottom as it did in 2006? I don’t think so based on other market data and individual stock action.
Anyway, be careful and don’t drink the kool-aid because the new lows paint a completely different picture than the indices or the media!


Chris,
Thanks for the in-depth analysis concerning these numbers and the added insight as to what could be setting up here. In my mind right now, all I can think of what you have stressed in the past: “Remember the M in CANSLIM” and curious as to whether your screens are showing less and less quality stocks to be returned at this point that show more of the true condition of what is occuring.
Overall, I would love to see this market continue going forward higher, but after a few slaps in the face this year, I don’t want to be faked out by one of these false movements so I can be sucker punched later.
Chris,
You are right on target. Don’t trust the verbage.
On Friday the Fed could not insert enough liquidity so the market went down. Institutions sold stocks in volume which overran the liquidity. On Monday the selling volume was still there but more liquidity was used to prop up the DOW and bonds. Look for it about the time of the Fed report on Tuesday.
This market wants to go down but the insertion of large amounts of liquidity skews the results at end of day. Everyone including the institutions want to be in sync with a moving market. The Fed liquidity keeps pushing it up. At what point does it end like the housing, mortgage, etc. markets.
Hi Chris…nice post.
Chris,
Thank you for sharing all your great work with us. I am in agreement with your analysis, however, I’d like to know your thoughts on Dr. Brett Steenbarger observations on the possibility of the beginnings of strength right here.
http://traderfeed.blogspot.com/2007/08/stocks-making-new-highs-early-signs-of.html
Nice Post!
Thanks for sharing!
Chris,
All I am doing is taking time to read -High Probability Trading- by Link…from your books list! Excellent read and add to my library.
best.
I’m not so sure that the market’s tentative strength is to be disbelieved. The VIX hit 25 on Friday, Aug 3, and high VIX readings tend to be good times to buy. The McClellan Oscillator was showing a positive divergence as well.
My guess is that we had a secondary reaction in a bull market, but that’s only my opinion.
It seems that waiting after a dip until the percentage of stocks (NYSE or NASDAQ) that are above their 50-day moving averages comes back up to, say, 35% has hardly any penalty associated with it.
In particular, see http://stockcharts.com/h-sc/ui?s=$NYA50R&p=D&yr=2&mn=0&dy=0&id=p44713786576 , which is a chart of the 50-day percentage for the NYSE.
(I find that if I go to the annotate link at the bottom of the chart then it becomes easier to see the alignment of the data because I can then draw horizontal and vertical lines on the chart.)
Well, I held off as long as I could today to see how things would end… but it was looking positive throughout so just before the bell I went long…
We’ll see how this turns out!
Great observation Chris and it’s one I thought too as I read the same article in IBD. IBD usually does a good job of keeping score at times like these. I don’t totally disagree with the article. Using follow-through criteria in market timing, one needs to have several of these type days over a period of a few days. IBD did a poor job of explaining this which is why I think, many people may come to the wrong conclusions on this one.
Peter,
There should be a bounce here as we are seeing because the NH-NL levels were extreme and this has pinpointed reversals. However, I don’t buy into the long term upside of the current bounce. Too many leaders sliding and too many new lows over the past three weeks.
Terry,
The short term buys are fine but the NH-NL ratio is suggesting that that market will correct 10-15% from current levels over the next several months.
Clark,
IBD is an excellent publication but they tend to lean bullish (in the seven years I have subscribed). We’ll see what happens. I see short-term upside right now based on several technical indicators but the deeper signals say a correction is around the corner.
All Others:
THANK YOU for the positive comments!
Good post. IBD should be all about the numbers, but from time to time (most of the time, really)slips into cheerleader mode on both the editorial and stock pages.
It was surprising to see them make this call – maybe technically it confirmed a rally according to their criteria but it never pays to be so rigid. After all IBD has had to adjust their criteria in the past for confirming a rally .. maybe it’s time again. These rumor/comment driven whipsaws can cause quite a few false positives/negatives using any kind of rigid criteria for making market timing calls. It’s a good reminder that you have to have your own system and trust your own analysis.