Challenging the 200-d m.a.

Today’s screen is covering stocks that are trading below the 200-d m.a. and are currently attempting to challenge the line for the first time since their fall from 52-week highs. The first failed attempt to recover the 200-d m.a. is typically an opportunity to short or a signal to buy put options.

However, historical charts show that the likelihood of an ideal short setup comes when the 50-d m.a. is trading below the 200-d m.a. By the time the 50-d m.a. crosses below the 200-d m.a., a second challenge is taking place and this is where I look to initiate a position. I will be watching these stocks for that type of opportunity.

031608_nuva_daily.png

031608_flir_daily.png

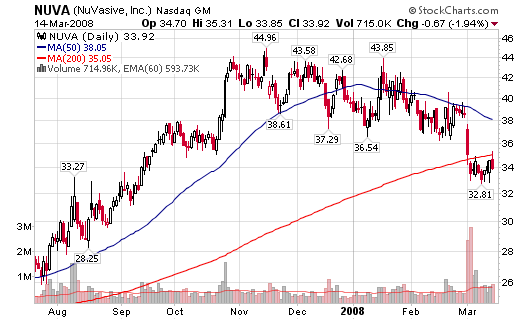
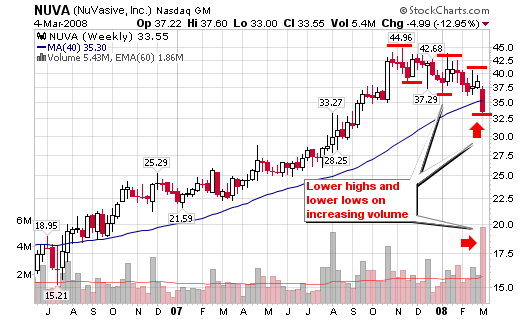
  • NUVA – 33.92, screened a couple weeks back as the stock is now trading below the 200-d m.a. The stock is now trending back towards the 200-d m.a., also known as the next ideal short setup.
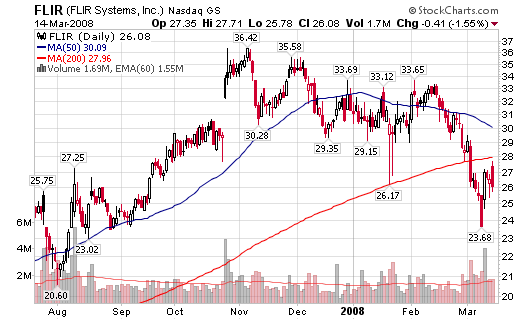
  • FLIR – 26.36, NuVasive reversed on Friday after a failed attempt to recover the 200-d m.a. The 50-d m.a. is still above the 200-d so this will keep me on the sidelines. However, the failed recovery and a crossover in the future will catch my attention for a trade setup
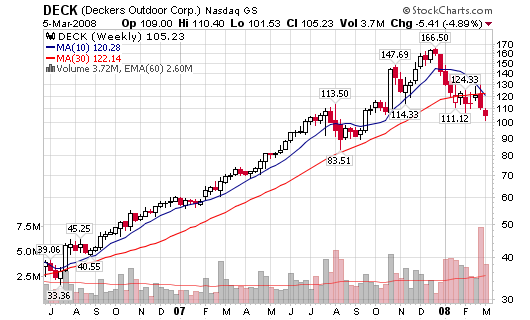
  • DECK – 105.23, the stock has moved from $89.88 to $102 over the past few days as it looks to challenge the 200-d m.a. for the first time. A failed attempt to recover this line will be the first short setup/ opportunity. I would like to see the 50-d m.a. fall below the 200-d m.a. before initiating a position.
  • CRL – 56.02, Charles River is in the same boat as FLIR and DECK as the 50-d m.a. is still trading above the 200-d m.a. The stock reversed on Friday as it attempted to recover the line.
  • OII – 61.30, the stock was up almost 3% on Friday on strong volume but the 50-d m.a. recently crossed below the 200-d m.a. The downturn of the 200-d m.a. is still premature but the overall trend seems ot be turning downward.
  • STRA – 156.00, the strong education stock is starting to hit hard times as the 50-dm.a. is trending downward towards the 200-d m.a. The price is currently challenging the 200-d m.a. for the first time in years.

[Read more…]

Stages of a Stock Breakdown

The five charts tonight profile what a stock looks like as it starts to breakdown and become a prime shorting candidate. I have been highlighting multiple shorting candidates (stocks trending downward) over the past several nights with the exact characteristics of the charts below.

Recent stocks trending down:

Stage I
Bunge – 96.00, is a stock that is starting to breakdown after a prolonged period of up-trending price increases. The stock continuously maintained a position above the 30-week moving average after the 10-week moving average crossed above it in the summer of 2006. However, recent action suggests the stock is going to fall as the 10-week moving average is now pointing down on above average volume. A cross of the 10-week moving average below the 30-week moving average is a major red flag and sell signal. The first failed attempt to recover the 30-week moving average is the ideal shorting signal.

031008_bg_wkly.png

Stage II
SYK – 59.74, here is a stock that also enjoyed a prolonged period of up-trending prices from the summer of 2006 until the close of 2007. The stock started to drop hard on above average volume in January of this year and now shows signs of a prime shorting candidate. The 10-week m.a. is now below the 30-week moving average with both lines starting to point south. The next failed attempt to recover either moving average is a short setup. Rallies will occur and this is where opportunity will lie.

031008_syk_wkly.png

Stage III
MS – 38.30, Morgan Stanley is a stock that has been hit hard since the collapse of the credit markets and the sub-prime fallout. The 10-week moving average gave us the exact moment to classify this stock as a red flag back in July of 2007. From there, the stock failed to recover the 30-week moving average and presented a prime shorting opportunity. Only the best traders took this trade as the overall market was still trending higher. The extreme volume confirmed the downward spiral that would follow and the stock has yet to recover the 10-week moving average. Day traders will continue to short every failed rally attempt back to the 10-week or 50-day moving average

031008_ms_wkly.png

[Read more…]

Daily Screen for Monday 3-10-08

The market and individual stocks in general continue to get pounded so my screens will continue to provide us with short candidates or stocks trending lower. Today’s screen gives us five stocks that show the 10-week moving already below the 30-week moving average and two stocks headed in that direction.

Recent stocks trending down:

030908_cmtl_wkly.png

030908_ve_wkly.png

10-week average below the 30-week average:

  • CMTL – 42.59, the stock dropped $4.66 on Friday on volume 147% larger than the average. We also witnessed a large reversal at the 30-week moving average as the 10-week moving average continues to move lower.
  • VE – 75.43, the stock was down 15.29% last week with volume 350% larger than the 50-d m.a. on Friday (it was the largest weekly volume in years).
  • MR – 30.99, one of the top performing stocks on this blog in 2007; but it is now facing some trouble as the 10-week m.a. is below the 30-week moving average. Volume is starting to increase during distribution weeks.
  • MORN – 60.95, the stock failed to complete the $60-$100 run as the 10-week m.a. is now below the 30-week moving average. Volume is increasing with multiple distribution weeks over the past four months.
  • SI – 123.53, Siemens is falling on above average volume with a recent reversal at the moving averages. Both the 10-week and 30-week moving averages are trending downward.

[Read more…]

10-Week Crossing Below 30-Week Moving Average

In keeping with last night’s theme, I will highlight five stocks that are trending downward on above average volume after reaching 52-week highs within the past six months.

Tonight’s stock charts show a declining 10-week moving average that is now trading below the 30-week moving average. The 30-week moving average is just starting to point downward in most of these charts. Trader Vic wrote in his book:

  • “When the 10-week moving average crosses the 30-week moving average and the slope of both average is down, this comprises a sell signal, provided prices are below both moving average line”
  • “Of course, as with all technical observations, these observations are never right 100% of the time.”
  • “The biggest mistake anyone can make in using moving averages, or any technical observation for that matter, is to fall in love with it”

With that said, I will admit that I love using the 10-week/30-week indicator when looking for longer term trend changes and buy/sell signals.

030508_deck_wkly.png

030508_gme_wkly.png

Tonight’s stocks include:
DECK – 105.23 – hat tip to Mike in comments
GME – 45.23
CETV – 84.80
YZC – 76.46
ALXN – 59.20

[Read more…]

Hurting Stocks to Short?

Today’s stocks look poised to fall further from their recent 52-week highs. All five stocks were down on above average volume Tuesday as they trade below their long term 200-day moving average. Volume is increasing on both the daily and weekly charts as they continue to log lower highs and lower lows.

Add to the fact that they are all several months removed from their 52-week highs and we have PRIME candidates for shorting or put options (whatever your forte).

I detailed the characteristics of longer term shorts in the two blog posts below. The rules in these posts are the exact ones I follow for longer term shorting (I lean towards put options). Remember, I am not day trading for quick profits; I am looking for trends that will last from weeks to months.

030408_cetv_wkly.png

030408_nuva_wkly.png

*Disclaimer: These stocks are not trade recommendations; they are purely provided as equity research. Please do your own due diligence and consult a financial advisor before trading (especially shorting).

  • CETV – 84.00, the stock was down 9.44% today on volume 764% larger than the average. We will go on to have the largest weekly volume in years by the time the market closes Friday. Lower highs and lower lows with the stock breaking below the 200-d m.a. shows tremendous weakness. A drop to the $66 area and then $55 is not out of the question.
  • NUVA – 33.55, the stock was down 4.39% on volume 595% larger than the average. The 13% drop this week has taken the stock below the 200-d m.a. on the largest volume in years. Heavy institutional distribution.
  • FLIR – 26.36, the stock was down 9.35% on volume 137% larger than the average. Today’s move took the stock below the 200-d m.a. on heavy volume, the largest in months.
  • IBN – 46.91, the stock was down 6.70% today on volume 113% larger than the average. Four consecutive down days has led the stock below the 200-d m.a. on increasing volume. Lower highs and lower lows has been the recent trend.
  • YZC – 77.40, the stock was down 7.37% on volume 99% larger than the average. Lower highs and lower lows is the trend as the stock could be headed towards the $64 area and then $50 if the trend continues.

030408_yzc_wkly.png

[Read more…]