Chris Perruna Stocks in Review 2007

2007 Case Study/ Stock of the Day/ Highlighted Stocks Update
It was a phenomenal year for trend traders of small and mid cap growth stocks! Of all the stocks mentioned on this blog, only 32 were covered extensively. These stocks were detailed in case studies, stock of the day analysis or highlighted in one or more daily screens.

Most covered CP stocks in 2007:

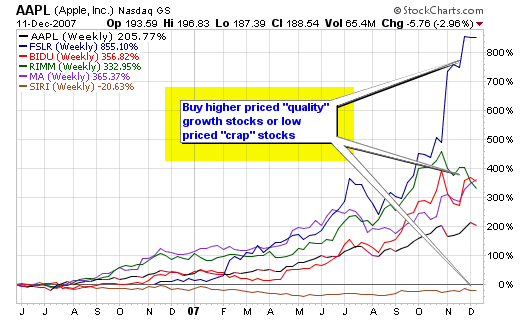
  • BIDU: 31 times, 314% peak gain (debut 4/25/07 at $103.50; current price $399.67)
  • JASO: 21 times, 211% peak gain (debut on 6/13/07 at $24.55; current price $75.02)
  • EDU: 18 times, 149% peak gain (debut on 2/2/07 at $36.93; current price $84.06)
  • MA: 17 Times, 112% peak gain (debut on 4/2/07 at $107.28; current price $209.48)
  • MR: 13 times, 81% peak gain (debut on 1/30/07 at $24.95; current price $43.41)

122707_top_stocks.png

Overall, the group of 32 performed marvelously over the course of the year and their results would have made most investors very happy; a solid expectancy for a trend buying system during an up-year.

A simple buy and hold strategy (through Wednesday’s closing prices) would have the portfolio at 17 winners and 15 losers. Please note that I do not recommend buy and hold investing. Sell rules are extremely important and can be found throughout the site. Money management rules are a must while investing but I decided to show you what a simple buy and hold strategy could do if you invest in young growth stocks while trending higher.

General Statistics:
53% win ratio (69% winning percentage using sell rules)
74.9% Average Winning Trade
23.9% Average losing Trade

314% – Top Peak Gainer
42.1% – Worst Loser (does not include sell rules – approx 10% max loss would be incurred).

149% – JSDA, Top Peak Gainer currently showing loss (would have been sold for 87% gain)

Employing a basic 10% sell stop from purchase price while using the simple buy and hold strategy would currently have the portfolio of 32 stocks at a collective gain of 43.4% or almost 10 times that of the S&P 500.

Not bad when covering a wide variety of stocks on a blog over the course of one year.

[Read more…]

Higher Priced Stocks Give Best Gains

Lower Priced Stocks Don’t Double Faster!

I cringe every time I hear a novice or even a long time investor tell me that they only purchase low priced stocks because they offer quicker potential gains. A common phase I hear is:

“I like to buy $1 and $2 stocks because they can double easily and I can afford them”

You can afford them? To start, a $1,000 account is a joke but to actually say the above statement and believe what you are saying after thinking about it is insane. A 50% gain is a 50% gain regardless of how many shares are in your portfolio. So, should you be buying 100 shares of SIRI because you love Howard Stern and can “afford it” or should you be buying Apple (AAPL) because you love it as it crosses $100, $150 and $200 per share? The novice says they can’t afford a $200 stock. Please smack yourself because you can afford it but in your mind, you can’t afford a nice round lot purchase of 100 shares (who cares, you’re trading small to begin with – making money is your only concern). One share or one hundred shares: a gain is a gain and a loss is a loss.

121107_high_priced.png

I rather own 15 shares of Apple than 100 shares of Sirius or a similar beaten down piece of garbage. I could care less about the number of shares in my account.

I care about making money – MY PERCENTAGE GAIN AT THE END OF THE YEAR!

Hell, I would’ve bought one share of Berkshire Hathaway at $100,000 before I would consider much of the hopeless crap treading along the bottom of the market’s ocean.

“Stocks are priced low for a reason, just as stocks priced high are there for a reason”.

Like anything in life, quality is never offered at a discount. In most cases, life offers its best material possessions at premiums.

A $1.00 stock is trading this low because it is only worth this much in investor’s eyes. A stock priced at $100 or $200 is trading at these levels because of a quality that the lower priced stock does not have (in most cases). Institutions, such as mutual funds, banks and insurance companies will not purchase a stock at $1 based on strict internal rules and fund guidelines.

Stocks such as First Solar (FSLR) move quicker than dirt cheap crap due to the vast amounts of support from institutions that have the buying power to propel prices 100%, 200% or more in less than 12 months.

  • Apple (AAPL) is up almost 300% in eighteen months
  • First Solar (FSLR) is up almost 900% over the past 13 months
  • Baidu.com (BIDU) is up almost 400% over the past 18 months
  • MasterCard (MA) is up almost 400% over the past 18 months
  • Research in Motion (RIMM) was up almost 500% over the past 18 months
  • Garmin (GRMN) is up almost 300% over the past two years
  • Petrochina (PTR) was up more than 200% over the past 2 years
  • Mcdermott (MDR) is up more than 300% over the past two years
  • Google (GOOG) has doubled over the past year or so

The stocks above were trading at these prices June 1, 2006 (pre split adjusted):

  • AAPL: $62.17
  • FSLR: $27.89 (12/1/06)
  • BIDU: $83.43
  • MA: $47.51
  • RIMM: $65.91
  • GRMN: $97.12
  • PTR: $106.45
  • MDR: $44.84
  • GOOG: $382.62

So, would you rather own low priced media mentioned stocks such as SIRI ($4.51 on 6/1/06 and $3.50 today) or the higher priced $40, $50, $60, $100, $200 and $300 priced stocks above. I’ll take the 300%, 400%, 500% and 900% gains of the higher priced stocks over the losses or minor gains from the lower priced options.

121107_fslr_daily.png

A quick study of stock market history will prove that the majority of stocks priced at $2 or less will be de-listed or bankrupt before they ever give an investor a triple digit return. High quality stocks are typically representative of high quality companies that usually have innovative products or services that are increasing revenues and earnings thus peaking institutional interest. You have all watched more stocks double or triple from the $25-$100 range on this blog than any other price level during the past year (chrisperruna.com is one year old this month).

I bought BIDU at $103, MA at $107, FSLR at $101 and AAPL at $130 this year alone (I rounded the cents). How many sub $5 stocks did I buy this year? NONE!

[Read more…]

A Blackberry Pearl from RIMM

Making a Christmas List: Part V

A blackberry Pearl from Research in Motion (RIMM) is an excellent gift for anyone that wants to have their e-mail, calendar, contacts and more on the go. I mentioned that Apple is a great company but the Blackberry is all anyone carries in NYC (because it works so well with Microsoft and unfortunately, that is what everyone uses). If I had to guess, I would say that 7 out of 10 professionals carry some form of a Blackberry in the tri-state area (if not more).

Below is the case study I did for RIMM on April 8, 2004 when the stock was trading at $104.21 per share (now a split-adjusted $17.58). RIMM closed at $122.08 for a 594% gain in 3.5 years (if you or I was a holder the entire time).

I started coverage of RIMM during a “Piranha’s Weekly Market Watch” on January 11, 2004 at $76.25 or a split adjusted price of $12.71 (an 860% gain).

Of all the research I did for MarketStockWatch.com (while it was open prior to chrisperruna.com), my analysis of the start of the bull market has been my most proud accomplishment (and a piece of it can be read within the RIMM case study as well).

Chart of RIMM in 2004 (originally posted on MarketStockWatch.com):

112907_rimm_2004.png

CASE STUDY – FLAT BASE on top of FLAT BASE
RIMM – Research in Motion Ltd.
Industry – Telecom-Wireless Equip

Piranha’s Weekly Market Watch – listed on 1/11/04 at $76.25
RIMM peaked yesterday at $111.35, a 46% gain in 3 months

Chart Legend:
1. The general market (DOW and NASDAQ) had a follow-through day and shows the first signs of a possible new bull market (March 2003). RIMM makes solid gains above the 50-day on the largest volume in almost 5 months. 50-day MA is starting to flatten from recent down trend. RIMM begins its first up-trend during the new hot market.
2. RIMM consolidates into a 7-week flat base (the min. number of weeks required to qualify for a flat base).
3. RIMM breakout of the flat base on the largest volume of the year. The second leg of this run is now underway.
4. RIMM decided to consolidate for a second time and forms another flat base, this one lasting 11 weeks – notice how the volume dropped during the building of this base – a very positive sign.
5. RIMM breaks-out on the largest volume EVER. Stock is up 50% this week on the second consecutive positive earnings report. (Posted on Piranha’s Weekly Screens soon after this powerful breakout).
6. Notice how the relative strength and volume have increasing during the entire run of the past 12 months – very positive.

RIMM is currently showing some sideways action but is among some top leaders over the past 12 months – MBT and VIP.

I hope you enjoyed the case study.

So, how do I feel about RIMM today? The same way I do about all the stocks on my Christmas list: I should have bought and held during the bull market. The earnings are fantastic! Analysts revised their guidance for 2007 and the company still shattered the number (by 192%).

112907_rimm_crossover.png

The stock is currently trading at the 50-day moving average for the third time this year, a line of support it has held since May 2007. Longer term, the stock is still in a very bullish up-trend that confirmed in September 2006 after the 10-week moving average crossed above the 30-week moving average.

I don’t own shares of RIMM at this time but it’s not a bad area (right now) to establish a position with a tight stop as we flirt with all-time highs. Ideally, I would like to accumulate shares near the 200-d moving average but the stock is currently trading about 40 points higher than that area.

Earnings:
FY 2005: $0.70
FY 2006: $0.84
FY 2007: $1.11 (beat estimates by 192%)
FY 2008: $2.17E (looking for a 95% jump next year)
FY 2009: $3.26E

ROE: 33.82%
ROA: 26.94%
P/E Ratio: 79.39
PEG Ratio: 2.18

112907_rimm_daily.png

An iPod touch from Apple (AAPL)

Making a Christmas List IV

Music, videos, photos and websites in 8GB and 16GB models starting at $299.

How could you go wrong? I want an iPod touch from Apple almost as bad as I wish I held the shares I once owned. I have actually owned shares in Apple several times including the present but have always sold during down turns (so much for timing the market with this superstar). Superstar is an understatement with this stock.

Of all the possible gifts on my list, the latest iPod touch rises to the top due to the affordability, the usability and the “cool” factor.

I do have one reservation: Why can’t a company such as Apple (AAPL) create a screen that will be easy on my eyes and allow me to transfer my subscription of Investor’s Business Daily (e-IBD) in PDF format so I can read it anywhere at any time?

Can someone please invent a portable PDF reader that is easy on the eyes (Amazon has a solid product but it does not allow the transfer of PDF documents). If anyone can do it, Apple will and they will do it right. This is why the company and the stock have been one of the great stories of this bull market.

Stock Analysis:
Words can’t describe what this first chart shows us!

112807_aapl_monthly.png

The second chart shows us that Apple successfully made a 10/30 week crossover to the upside in September 2006 above $70 per share, a 157% gain to date. The 50-day moving average has been the most recent support level but I would still use the 200-day moving average as the ultimate test of time. A new high and a move above $200 per share will be very bullish and a signal that this stock may have another run regardless of what the major indices do.

112807_aapl_1030.png

Rating: Hold (accumulate on dips) – trend is still higher.

Earnings:
FY 2005: $1.44
FY 2006: $2.27
FY 2007: $3.93
FY 2008: $5.00E (27.23% increase)
FY 2009: $6.23E

ROE: 28.52%
ROA: 16.43%
P/E Ratio: 44.46
PEG Ratio: 1.97

Institutional Analysis:
Total Institutions: 2,545
Money Market: 1,006
Mutual Fund: 1,459
Other: 80

Shares Held: 880.5 mil
Shares Held Previous Period: 849.6 mil

Shares Bought: 125.68 mil
Shares Sold: 94.78 mil
Value of Shares Bought: $19.2 Bil
Value of Shares Sold: $14.5 Bil

Prior coverage of Apple (AAPL) on the blog (stock screens not included):

1/17/07: All-Star Stock – Digesting Apple

Apple has been on my screens for 15 months and has been in my portfolio on two separate occasions over those 15 months. The most recent purchase was last summer as it broke into the $40 range. The first screen Apple made on MSW was on 10/24/04 at $23.71 (split adjusted from $47.41 – my actual entry area).

Since adding the stock back to the screens in July, Apple has gained over 100% and has moved up into the $60-$100 range. Overall, a long term holder from my initial coverage in October of 2004 would have a gain of 260%+. Two weeks ago, I said this to the community: “trend buyers could add shares now”. If they did, they are now up an additional 12% from the latest breakout point.

1/10/07: Apple Inc. is Still Green

What can I say; the apples keep getting greener! Apple Inc (the new name) unveiled its new iPhone and AppleTV yesterday as the stock was up over 8%.

1/13/05: Green “APPLE”s

Apple (AAPL) first showed up on my weekly screens on 10/24/04 at $47.41 (split adjusted 23.71). Since this time, Apple has made the daily and weekly screens numerous times.

The lesson of this blog is to pay attention to the charts, not the news. The charts showed us a buy 10 week ago and confirmed this buy several times since late October. Many people went out and bought Apple today based on the great news from yesterday (Apple shattered estimates).

10/25/04 – 10/29/04: $52.40

11/22/04 – 11/26/04: $64.55

11/29/04 – 12/03/04: $62.68

12/06/04 – 12/10/04: $65.15

01/03/05 – 01/07/05: $69.25

The most recent daily post was on 01/05/05 at $64.50.

Christmas List Series:

Next up in this 5-part Series:

  • Part V: A Blackberry Pearl from Research in Motion (RIMM), using the Verizon Wireless (VZ) Network

Suit Time at the Men’s Warehouse (MW)

Making a Christmas List – Part III

“You’re going to like the way you look” and “We guarantee it” – the trade mark quotes voiced by the Men’s Warehouse (MW) Founder and CEO, George Zimmer.

Who hasn’t watched one of those commercials?

Well, they worked on me because I own several suits from the Men’s Warehouse and will go back based on the quality service of their staff. I never feel pressured and always walk out with more than I anticipated (that’s a good store). I recently purchased two high quality brand name suits and a brand name overcoat for $1,000. I don’t think I could have found a better deal anywhere else. I (possibly) could have spent less at a SYMS store but not any of the major retailers (even with sales), never with an actual tailor or the local mom and pop shops. Forget about Manhattan!

You walk in, select the styles you like, try them on, get them measured by an in-house tailor and you will have your suits in no time (a couple days at most). I’m sold. However, the company and the stock are usually two different stories.

So, what does the stock look like?

112707_mw_5yr.png

I’ll start by saying that I made the same mistake with the Men’s Warehouse as I did with Toyota (TM) (my Lexus). I should have bought several thousand dollars worth of the Men’s Warehouse back in 2003 when it was trading as low as $7.77 (below $10 for the sake of this post).

It went on to gain 628% over the past five years with a 33-fold gain from base to peak since the IPO in the early 1990’s.

Now is not the time to buy the stock as it is currently trading below the 50-day average and the 200-day moving average. The 10-week moving average has also crossed below the 30-week moving average which signals a sell (not a buy in this case).

MW has violated the above mentioned moving averages in the past and has recovered after building a base for several months. The correction in late 2005 and early 2006 took more than a year before new highs were reached. This is a stock that needs to be treated with patience as we don’t need to jump the gun and enter prematurely. The stock reaped the rewards of the bull run from 2003 to 2007 so now will be the test to see if the Men’s Warehouse can and will remain a consistent money maker heading into 2008 and beyond.

112707_mw_weekly.png

Let’s look at the earnings, valuations and institutional numbers.

Earnings Watch:
FY 2005: $1.31
FY 2006: $2.04
FY 2007: $2.62
FY 2008: $2.98E (a 13.74% increase over 2007)
FY 2009: $3.41E

ROE: 23.79%
ROA: 15.28%
P/E Ratio: 11.85x
PEG Ratio: 0.79

Institutional Analysis:
Total Institutions: 700
Money Market: 233
Mutual Fund: 448
Other: 19

Shares Held: 78.88 mil
Shares Held Previous Period: 73.39 mil

Shares Bought: 16.41 mil
Shares Sold: 10.93 mil
Value of Shares Bought: $835 Mil
Value of Shares Sold: $556 Mil

Christmas List Series:

Next up in this 5-part Series:

  • Part IV: A Video iPod from Apple (AAPL)

Future Wish List Items:

  • Part V: A Blackberry Pearl from Research in Motion (RIMM), using the Verizon Wireless (VZ) Network