I wanted to get these charts up before the market opened and will follow up later this morning with a full text analysis. Still getting back into the swing of things. By the way, I grabbed NMX options yesterday for Jan 08.
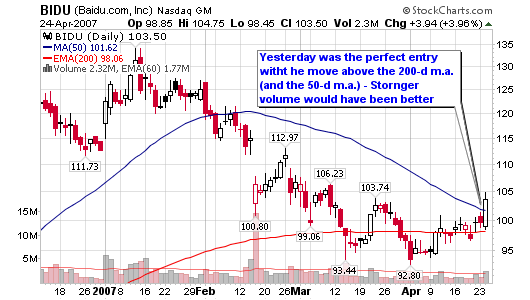
Short term target for BIDU is $118 area based on point and figure chart and fibonacci retracements.


Hi Chris,
I was able to look at the Point & Figure chart at stockcharts to see the Price Objective (PO) of $118, but would you be willing to show a screen shot example of how you used the Fibonacci retracement in setting your target price?
Also, a while back in March prior to your leaving for your trip, I had asked if you would be willing to write up an article on showing examples of setting price targets and explaining more on your risk-to-reward ratio. I am hoping you can still prepare an artcile on this for further education.
Thanks,
Steven
Steve,
I am long overdue for the article on target prices and have promised you that I would get it up on the blog. It’s coming and BIDU is a nice chart to use for the Fibonacci retracement target. As I will explain, nothing is guaranteed but its all based on probabilities and that is how we should all trade.