Below are the updated charts for the stocks leading the market and the cp blog.
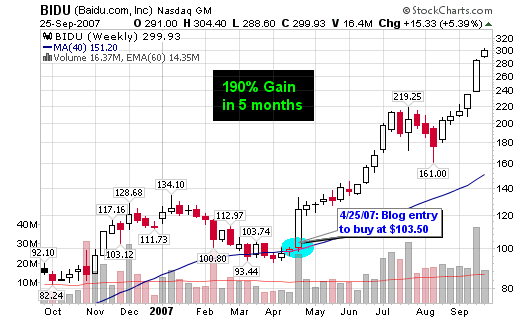
- (BIDU) Baidu.com
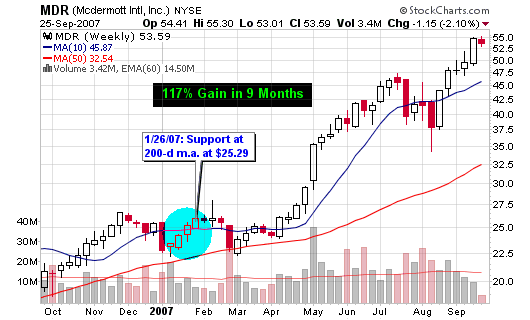
Baidu.com (BIDU) buy Opportunity and BIDU Stock Analysis - (MDR) Mcdermott Intl., Inc.
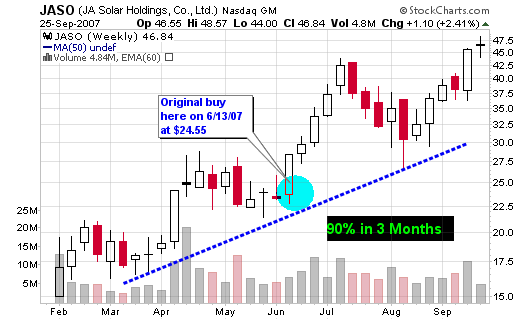
Support at the 200-day Moving Average - (JASO) JA Solar Holdings, Co., Ltd.
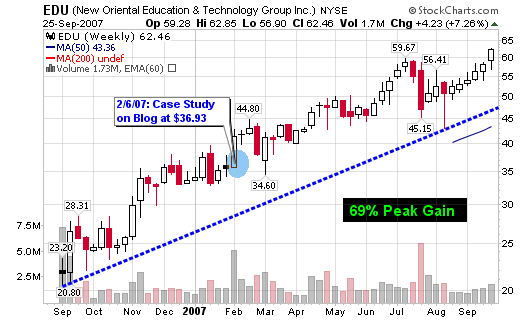
Fresh IPO Ideas - (EDU) New Oriental Education & Technology Group Inc.
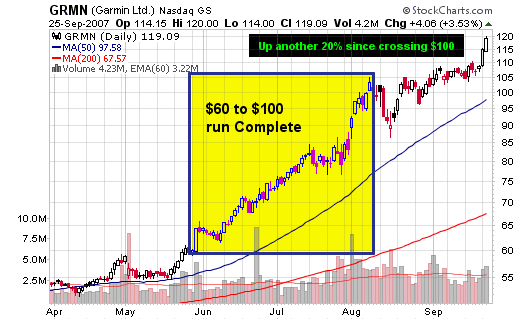
Learning about New Oriental Education (EDU) - (GRMN) Garmin Ltd.
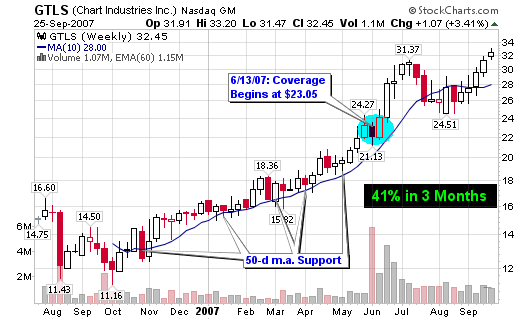
Support at the 200-day Moving Average and Tracking Garmin (GRMN) - (GTLS) Chart Industries Inc.
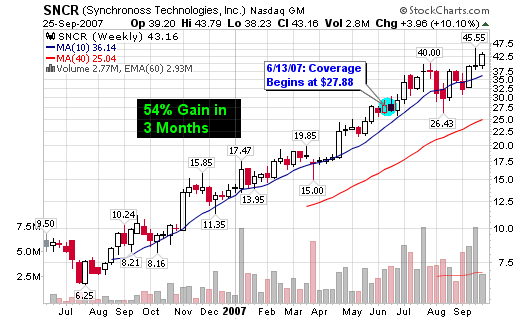
Fresh IPO Ideas - (SNCR) Synchronoss Technologies, Inc.
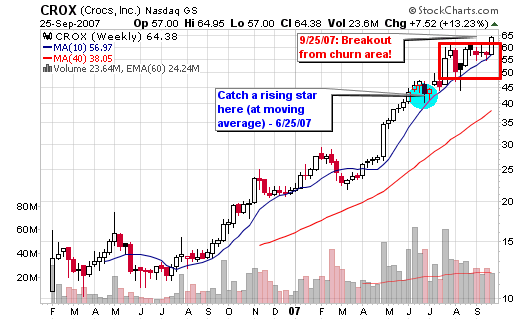
Fresh IPO Ideas - (CROX) Croxs, Inc.
Catch a Rising Star and Will CROX get Eaten?


Chris,
on Bidu chart, there is a gap up on heavy volume from around $240 to $280. If breakaway gap occured around end of april from $105 to $120 area, measuring gap took place in July from around $ 180 to $210 and now this gap from $240 to $280. Could this be an exhaustion gap and we will see a retracement soon?
You throughts?
Thank you.
Dima,
I do think we will see a retracement for two reasons:
1. It is extended and has been running straight up
2. Stocks like to pause at psychological numbers (especially rounds numbers like 100,200, 300, etc…).
I am not a buyer here if that helps. No setup for an ideal entry.