IPO, Stock of the Day Updates

A few stocks featured on this blog, as recently as last week, are moving higher so I would like to draw attention in their direction. All three stocks were found on my IPO fundamental screen which is explained in detail in this post: Fundamental Screens and Scans.

The first stock is CBEY, one that was highlighted as a Top 10 Stocks to Watch: Trend Buys in March of this year while it was trading below $30 per share. The stock has since made a move to $38 and currently holds a 32 % gain over the past three months. This was a piece of the analysis I gave when it debuted on the blog:

“CBEY – 29.03, the stock has been consolidating over the past four months without violating the 200-d m.a. so that is positive but recent volume has been increasing on distribution days. It is a buy if it holds support above the 200-d m.a.”

061207_cbey_wkly.png

LOOP came to us in April of 2007 after I returned from Hawaii. The stock was blasting out of a quadruple top breakout on the point and figure chart just shy of $19 per share. It closed one penny shy of $22 yesterday for a respectable 16% gain in less then two months. The stock has moved higher in seven of the past eight weeks with a clear up-trend above the trading range I highlighted in my original post: Quadruple top Breakout (LOOP)

Here is a taste of the analysis I gave during that original post:

LOOP – $18.93 “LoopNet was screened on MSW back in late 2006 as an IPO to watch in the future and may be starting the run that I anticipated it could take late last year. As we look for red flags on the downside, this green flag on the up-side is one to be noted.

The next major milestone will be a new all-time high above $19.92 (closed at $18.93 today).”

061207_loop_wkly.png

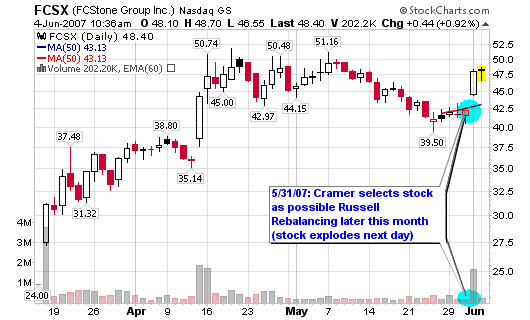
FCSX debuted on the blog last Monday after a nice boost by Cramer’s analysis the prior Thursday and Friday. The stock retreated to $45, an area just above my ideal entry of $42.50 and just above the current 50-day moving average. Yesterday’s 8.23% gain came on strong volume giving us another indication that institutional buyers are stepping in. It may be time to jump on this train before it takes off.
The original blog post and analysis can befound here: FCStone Group Inc. (FCSX)

“Potential Trade Set-up:
Risk a maximum of 1% of portfolio
Set a stop loss near $39.10 or higher (7-10%) with entry near $42.50 gap-up
Target of $63+ based on previous high to low action (pure speculative target)
Risk to reward has a potential of 6-to-1 based on exact entry, target and stop listed above.”

061207_fcsx_wkly.png

My IPO screener has been very successful this year but I must say that it can and does present me with 30 to 60 stocks every night so I use technical analysis to select the ones I believe will provide the most opportunity. I plan to upload another blog post later today that will feature three new IPOs that are grabbing my attention, both fundamentally and technically.

FCStone Group Inc. (FCSX)

Stock of the Day
FCStone Group Inc.
Friday’s Closing Price: FCSX – $47.96

Sector: Financials
Industry: Investment Brokerage
52-week Price: $27.25 – $48.70
Next Earnings: 7/14/07

060407_fcsx_daily.png

FCStone Group is another financial stock making its way to the “stock of the day” case studies here on the blog. Our most recent financial stock covered, GROW, decided to pop on Friday on heavy volume which was good news to everyone that established a position.

Today’s stock made my IPO screens over the weekend and saw a strong pop on Friday after Cramer noted it as one of his three stocks that may be part of the Russell rebalancing later this month. I was actually watching the show live when he named the three stocks and took a quick look at their charts but didn’t go further with my research at that time. The strong $5.67 price move along with the 358% increase in volume on Friday easily allowed it to make my weekend screens. Both the EPS ratings and the RS ratings (my main criteria for the screen) look extremely healthy so I decided to dig deeper.

The financials are below so I will start with a brief analysis of the daily and weekly charts. The weekly charts shows the stock blasting out of the IPO with a strong up-trend that lasted six weeks on strong volume. The stock consolidated over the next five weeks but volume was lower, a very positive sign. Institutional investors were holding their shares while the little guy was buying and selling.

You can see the sharp price increase above the 50-d moving average on strong volume Friday, the morning after Cramer’s buzz. Aside from the Cramer buzz and the possibility that FCSX may land on the Russell 2000, the stock is definitely one to watch from both a fundamental and technical standpoint. Due to a lack of trading history, we don’t have an ideal entry for a trade setup. Therefore, we must look to accumulate shares at or near the 50-d moving average or a new all-time high on strong volume. Look to add shares if the stock is closing the gap from Friday near $42.50 (see my potential trade set-up below).

[Read more…]

Cash Back from Mastercard and Baidu

Why charge when you can buy Mastercard in cash and make a 37% gain in two months. My physical stop has been placed with a GTC trailing stop 10% below the 52-week high. Any direct red flags (hard reversals on large volume) will force me sell prior to waiting for the trailing stop.

I first posted my analysis on Mastercard (MA) back on April 2, 2007:
Is Mastercard Priceless
$107.28 – “Bottom Line: MA is rated a buy in my book and I am grabbing shares today.”

I followed up this analysis with an update on May 3, 2007, Mastercard Pays Off, as the stock closed above $126; this still allowed investors a chance for a 16% gain to date.

053007_ma.png

Mastercard closed today at $147.13

Baidu.com (BIDU) was highlighted twice in one day as I recommended it as an immediate buy after returning from my Hawaii vacation in late April. It has worked well and now has a 31% gain in one month (not bad!).

Baidu.com (BIDU) buy Opportunity
$103.50 – “Short term target for BIDU is $118 area based on point and figure chart and fibonacci retracements.”

BIDU Stock Analysis
$104.34 (chart quote) – “Looking at the charts, I see a golden opportunity for a buy right here near the 200-d moving average with a confirmation above the 50-d moving average (which we got yesterday). “

“I mentioned a short term target of $118 earlier today based on Fibonacci retracement levels and the triple top breakout on the point and figure chart. A full 100% retracement and complete cup formation would take the stock back into the $130’s.”

053007_bidu.png

Baidu.com closed today at $135.69.

Don’t sell for the sake of selling and continue to follow the trend. Place your physical sell stops to guarantee at least a 20-25% gain in both stocks (preferably better). We don’t need to be greedy as the fundamentals still look solid for both companies. Ride the trend and don’t guess the top as some stocks that may seem high are still low to others!

Cash America (CSH)

Stock of the Day
Cash America Intl. Inc.
Wednesday’s Intra-day Price: CSH – $43.09

Sector: Financials
Industry: Consumer Finance
Next Earnings: 7/26/07
52-week Price: $28.76 – $47.98

My Take:
To start, I have one issue with this stock and company in general: they make consumer loans so earnings could slide drastically if the economy takes a big hit later in the year. However, a sustained bull rally should benefit the stock allowing it to continue its uptrend, especially since it has a large institutional following. If institutions bail, this stock can fall quickly and will hurt investors along the way. For that reason, I am raising the risk factor for accumulating shares at this point in time.

052307_csh_wkly.png

The company owns and operates pawnshops in the U.S. and provides pawn loans, and short-term cash advances, and check cashing and other specialty financial services to individuals. These services will be needed whether we are in an up or down economic cycle but the company runs the risk of defaulting loans if the economy tanks and unemployment rises; leading to loans that can’t be repaid.

Recent chart action shows support at both the 50-d and 200-d moving averages with volume increasing above average levels. The stock must cross back above $44.50 in order to establish a recent new high above the last peak. If it fails, cut the stock and move on as the rally could be done.

Looking at the weekly chart, the stock must rise above the dotted down-trend line I have placed on the chart. It is very important for the stock to rise above this line in order to continue the long term up-trend. Gauge the volume to understand if institutions are driving the price higher or dropping shares.

Potential Trade Set-up:
Ideal Entry: $41 to $42 (we will use $42)
Risk is set at 1.0% maximum of total portfolio or $1,000 of $100k
Stop Loss is 5% or $39.90
Number of Shares: 475
Position Size is $20,000
Risk is $2.10
Target is $46-$49
Risk-to-Reward at $46 is 2-to-1
Risk-to-Reward at $49 is 3-to-1+

Strong Sister Stocks:
MasterCard Inc. (MA)
CBOT Holdings Inc. (BOT)
Alliance Data Sys Corp. (ADS)
Intercontinentalexchange (ICE)
Total System Services (TSS)

Institutional Analysis:
Held by Institutions: 89.13%
Money Market: 193
Mutual Fund: 293
Other: 13

[Read more…]

Home Inns & Hotels Management Inc. (HMIN)

Stock of the Day
Home Inns & Hotels Management Inc.
Tuesday’s Opening Price: HMIN – $33.50

Sector: Leisure
Industry: Hotels and Motels
52-week Price: $21.50 – $49.50

My Take:
The stock blasted 7.51% higher yesterday on above average volume as it confirmed the move above the down-trend line and recovered the 50-day moving average for the first time since late February. As you will read below, the earnings released yesterday were positive and revenues increases by 65% (year-over-year).

052207_hmin_wky.png

The young stock has not formed a 200-d m.a. to date so we can only use the data available to make a trading decision. The recovery of the 50-d m.a. is positive and gives us the green light to set-up a trade and take a potential position. Ideally, the position should have been initiated near $34 but I had to wait until earnings were released, especially for a China based stock (the risk levels are increased with companies from this country).

Institutional support is increasing (see figures below) and most fundamental categories look solid. The P/E ratio is extremely high but that doesn’t scare me too much. High growth will cost more but it is an indicator to keep an eye on. I wouldn’t expect a value investor to give this stock a second look based on P/E alone.

Potential Trade Set-up:

  • I would risk between 0.005% and 0.01% of your total portfolio
  • My ideal entry would be near $34.
  • Set a stop loss of 10% (near $30.60).
  • Target price will be about $42 or the 61.8% Fibonacci level on the weekly chart. An aggressive target will be a full retracement to close the cup shaped pattern above $46.
  • At $42, the risk-to-reward will be just above 2-to-1 (not great)
  • At $45+, the risk-to-reward rises above 3-to-1 which is what we want as a minimum.

So, a $100,000 account will give you
Entry: near $34
1% Risk: $1,000
Stop Loss: 10%
Position Size: $10,000
Shares: 290
Stop Loss: $30.60
Target: $42-$45

[Read more…]