Grow with US Global Investors

Stock of the Day
US Global Investors, Inc.
Monday’s Intra-day Price: GROW – $21.86

Sector: Financials
Industry: Asset Management & Custody Banks
52-week Price: $36.36-$8.78

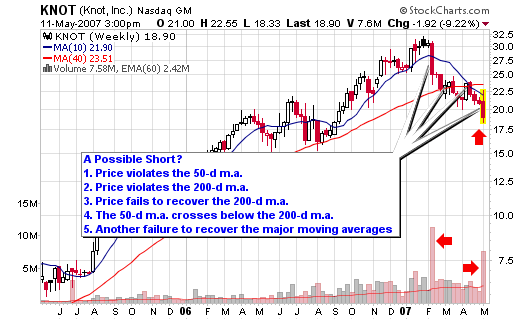
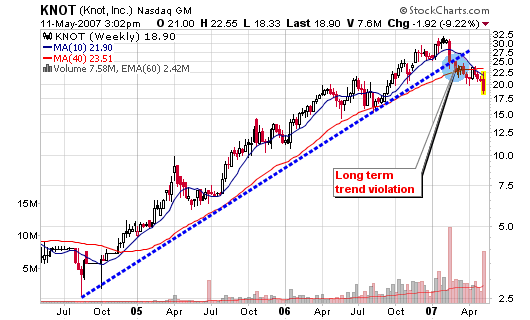
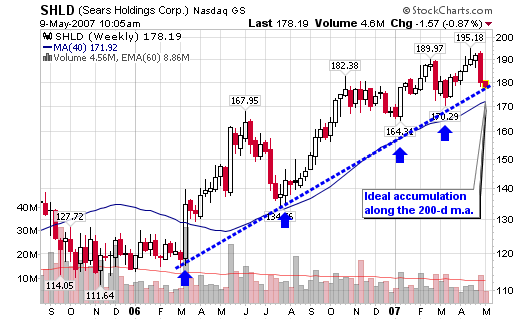
This stock has held the 200-d moving average for several years and is currently trading on the line with an ideal risk-to-reward setup for longer term trend buyers. Institutional sponsorship looks to be slipping based on the lower volume figures on the chart and the actual reporting numbers listed below.

052107_grow_wkly.png

However, the company has had impressive earnings and revenue growth over the past several years while exceeding the average for its industry. The company does not have debt therefore it sports a debt-to-equity ratio of zero which is excellent for investors.

My largest concern with this stock is the state of the overall economy and the effects of the housing slow-down. A major violation of the 200-d m.a. on heavy volume will be a red flag to sell your position or avoid taking a new position. See the breakdown for the potential trade setup below.

GROW is the investment adviser to U.S. Global Investors Funds and U.S. Global
Accolade Funds, which manage 13 no-load mutual funds with various investment objectives.

Institutional Analysis:
Held by Institutions: 17.97%
Money Market: 44
Mutual Fund: 21
Other: 5

Shares Held: 5.1 mil
Shares Held Previous Period: 5.2 mil

Shares Bought: 3.28 mil
Shares Sold: 3.36 mil
Value of Shares Bought: $90.2 mil
Value of Shares Sold: 92.4 mil

Top Institutional holders, Shares Held:
Bridger Management LLC, 555,848
Renaissance Technologies Corp., 503,020
Southpoint Capital Advisors LP, 500,000
Morgan Stanley, 314,976
Bridgeway Capital Management, Inc., 303,386

Potential Trade Set-up:
Risk a maximum of 1% of portfolio
Set a stop loss near $18.00 or higher (7-10%)
Target of $29+ based on previous action, Fibonacci levels and current location of 50-d m.a.
Risk to reward has a potential of 4-to-1 based on exact entry and stop.

[Read more…]

Mindray Medical (MR) Profit Jumps

Stock of the Day – Update
Mindray Medical International Ltd.
Tuesday’s Closing Price: MR – $26.77

The company reported better than expected earnings late Monday and blasted 7.34% higher yesterday on the strongest positive volume since its debut as an IPO last fall.

I owned shares in the company back in February of this year but sold when the stock struggled to make and then maintain new highs. Its Chinese counterpart, EDU, was performing better so I turned my attention in that direction.

Original Blog Articles for MR:
China’s Mindray Medical Intl. (MR)
Mr. Mindray on the Move

051607_mr_wkly.png

The stock never lost much ground but it wasn’t gaining any either, until yesterday. I wouldn’t get too excited unless the stock can blast into new high territory as noted on the weekly chart.

What interests me most are the most recent institutional numbers. Compare the numbers I found back in February to the numbers being published today. Somebody is accumulating the stock and this was my reason to buy in the first place. With the numbers stronger today, I wonder if the stock can make the move I expected earlier in the year.

Institutional Analysis:
Money Market: 60 (from 21)
Mutual Fund: 57 (from 75)
Other: 2 (from 4)

Shares Held: 29.7 mil (from 7.0 mil last period)
Shares Bought Last Period: 25.7 mil (from 6.4 million)
Shares Sold Last Period: 3.0 mil (from 0.2 million)

Value of Shares Bought: $598.8 mil (from $156.4 million)
Value of Shares Sold: $70.7 mil (from $4.9 million)

Top Institutional Holders; shares held:
Goldman Sachs Group Inc.; 9,106,788
Emerging Markets Management LLC; 2,542,100
FMR Corporation (Fidelity Management & Research Corp); 2,536,700
Fidelity International Ltd (Bermuda); 2,255,050
Marvin & Palmer Associates, Inc.; 1,440,100

051607_mr_daily.png

By Katherine Hunt
SAN FRANCISCO (MarketWatch)

Mindray Medical International Ltd. (MR) late Monday reported first-quarter net earnings of 122.4 million yuan ($15.8 million), or 1.09 yuan (14 cents) a share, up from 68.4 million yuan ($8.9 million) or 0.80 yuan (10 cents) a share, during the year-ago period. Pro forma earnings were 139.6 million yuan ($18.1 million), or 1.25 yuan (16 cents) a share. Net revenue for the three months ended March 31 rose to 422.4 million yuan from 318.3 million yuan, the Chinese medical device company said. Additionally, Mindray said it now expects 2007 net revenue to range from 2.12 billion yuan to 2.17 billion yuan, up from the previous range of 2.12 billion yuan to 2.15 billion yuan. Pro forma earnings for the year are now expected to be between 585 million yuan and 600 million yuan. The previous estimate was for earnings to range from 570 million yuan to 585 million yuan

My Rating: Accumulate Shares

KNOT a Buy, Maybe a Short

Is this stock a short candidate? Could we buy puts here?
Well, it topped several months ago and has violated several support levels (see chart as well):

  • Price violates the 50-d m.a.
  • Price violates the 200-d m.a.
  • Price fails to recover the 200-d m.a.
  • The 50-d m.a. crosses below the 200-d m.a.
  • Another failure to recover the major moving averages

051107_knot_wkly.png

I have screened the stock numerous times as a strong buy as it trended higher from the initial coverage on August 11, 2005 at $9.41 but the outlook has changed.

Go back to this post in December 2006 to see the details and extensive coverage on the Knot.com: Listen to your Wife, KNOT

It had a great run; I never actually bought and was pissed because it could have been the perfect stock for my wife (as explained in the December post) and is now setting up a classic longer term short pattern.

Should I take the trade?

I may just leave this one alone because I feel a bit of revenge as I write. I missed the huge gain but covered it the entire time (that hurts). I see the potential for a short but I could be wearing blinders so I will present this for anyone else that may want a short trade. Longer term puts may do the job here.

051107_knot_daily.png

Let me know your thoughts and have a great weekend!

Profit with these Stocks

I want to focus on four stocks that are leading the way for this blog in 2007 and in my own portfolio. As I mentioned in my interview with Dave over at Stockticker, I look for new growth stocks (IPO’s within a few years) that show increasing earnings and sales with charts that are trending.

I aim to take gains of at least 25% within a few months with a maximum loss of 7-10% (or less). I risk about 1% of my portfolio in each position and typically trade a risk-to-reward ratio of 3-to-1 or greater. As you can see, the stocks below (with the exception of HWCC) have all blasted to solid gains within the first few weeks of the initial trade.

Don’t get me wrong, I do have losing trades this year such as PTR (poor entry), ANDE, NYX and TWLL (my worst trade). I am currently showing a slight loss with my NMX options so don’t think I am this great trader that never loses. I win and I lose but my expectancy and overall performance is positive. As long as I cut the losers quickly, my winners will cover drawdowns and then some; giving me a smile on December 31, 2007.

Anyway, take a look at some of the recent plays we have made on this blog:

Learning about New Oriental Education (EDU)
EDU has been trending higher in a smooth consistent fashion; the exact type of pattern I like to see when trading a trend. The stock is now up 35% in three months and hasn’t flashed any signs of slowing down. The stock is rated a hold with new accumulation areas near the trendline on the chart.

051007_edu_wkly.png

Is Mastercard Priceless
Mastercard blew past earnings and now has a 30% gain in one month on some very heavy volume. The stop has been placed to guarantee profits but I will look to ride this trend higher if it allows. Ride your winners and give them some room to breathe. Stocks like this can end up being one of the few home runs you should hit each year. Current rating is hold.

051007_ma_wkly.png

Baidu.com (BIDU) buy Opportunity
This stock was a pure speculation play prior to earnings and it worked as it is now sitting with a 23% gain in two weeks. This is a trade that I will close immediately if a red flag flashes to ensure a 20% gain and nothing less. I will not close the trade for “a lack of reason” and will allow it to grow if it doesn’t violate my stop area. The stock does seem to have potential but it worries me more than my other positions. My current rating is hold (protect profits).

051007_bidu_wkly.png

Houston Wire and Cable Company (HWCC)
This stock is only up about 8% since the case study on the blog but it has consolidated into an area that seems to be ideal for adding shares. Looking at the chart, the $26 area seems to offer support on the long term trendline which sits just above the 200-d moving average. My current rating is “add-shares” for this stock.

051007_hwcc_wkly.png

Sears Holding Corp. (SHLD)

Stock of the Day
Sears Holding Corp.
Wednesday’s Intra-day Price: SHLD – $177.96

I’ve wanted to own shares for a long time now and have not had the chance to pull the trigger. With the stock currently consolidating towards the 200-day moving average; I am starting to determine if now is the time to grab shares (for a long term perspective).

050907_shld_weekly.png

The stock has been trending higher over the past fourteen months since the lows set just above $110 per share. I had an opportunity to enter last summer during the dip to $134 but I never pulled the trigger. We are considerably higher but that doesn’t concern me as buying high and selling higher is something I accept for quality stocks.

What concerns me is the possible shortfall in revenue due to competitors such as Wal-Mart (WMT) and Target (TGT). Revenue should decrease due to weaker same-store sales and the closure of underperforming stores. A slower US housing market will also limit the sales of appliances and electronics in Sears outlets while apparel looks to hold the stock steady across the K-mart stores.

Standard and Poor’s states that merger-related cost synergies and the repurchase of up to $604 million shares can help elevate earnings heading into fiscal year 2008.

So what does this all mean? It means that I am still bullish on a solid organization and will look to accumulate shares carefully along the long term 200-day moving average. This will be a position that will accumulate shares for a long term perspective (multiple years) which is different from my typical trend trading and swing trading strategies. See the charts for current ideal accumulation areas and past opportunities.

Next Earnings Date: 5/31/07
Sector: Consumer Discretionary
Industry: Department Stores
52-week Range: $195.18 – $134.56

Institutional Analysis:
Held by Institutions: 88.04%
Money Market: 415
Mutual Fund: 568
Other: 27

[Read more…]