Maidenform Brands Inc. (MFB)

Stock of the Day
Maidenform Brands
Friday’s Intra-day Price: MFB – $20.77

Next Earnings Date: Wednesday May 9, 2007
Sector: Consumer Discretionary
Industry: Apparel, Accessories & Luxury Goods
52-wk Range: $24.49 – $11.11

050407_mfb_wkly.png

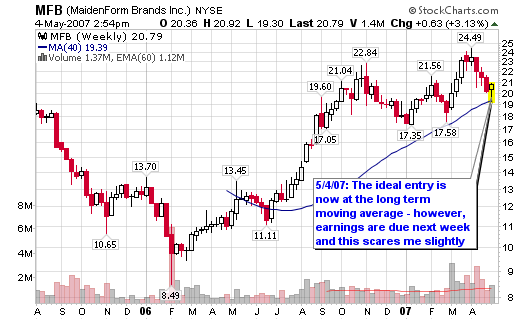
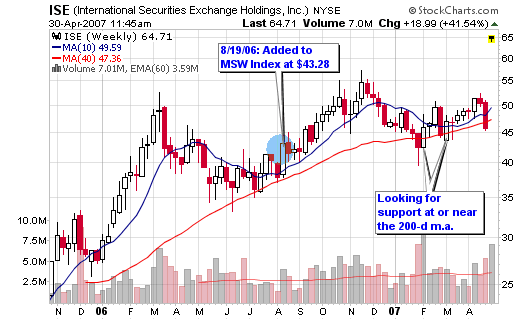
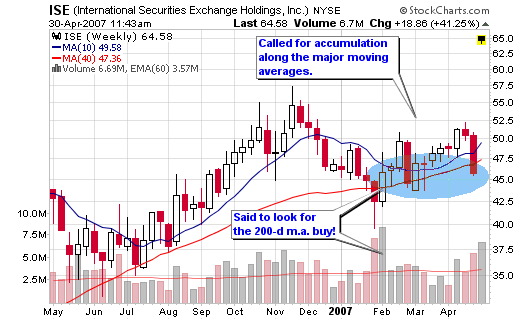
So what do we have? The technical aspects of this company look excellent with the ideal entry right now at the 200-d moving average. The stock has held the line as support two times over the past several months and looks to be a solid long term young stock. The strongest growth stocks are usually within 3-5 years of their IPO and MFB fits this criterion by debuting less than two years ago.

However, earnings are due to be announced next week and based upon Under Armour’s (AU) recent disappointment, I would be cautious. As of this writing, I have not added shares and do not own the stock personally. I will setup my risk-to-reward ratios this weekend and make the decision heading into Monday morning’s opening. I want to own the stock and now is the ideal point to accumulate shares but earnings scare me.

I don’t need to get caught in a severe gap-down that completely screws my risk factor and blows past my stop. If UA reported better expectations, I would be all over these shares right now. Other than that, the stock looks good heading into the future.

Institutional Analysis:
Held by Institutions: 70.59%
Money Market: 107
Mutual Fund: 161
Other: 8
New Positions: 62
Positions Sold: 21

[Read more…]

Mastercard Pays Off

Stock of the Day – Update
Mastercard Inc.
Wednesday’s Closing Price: MA – $126.35

I highlighted Mastercard as a case study on April 2, 2007 in a post titled, Is Mastercard Priceless, while it was trading at $107.28. Closed at $126.35 yesterday!

050307_ma_wkly.png

Here are two quotes from that post one month ago:

  • 4/2/07: “Longer term trend investors can establish a position now at the 50-d moving average or at least start to initiate a position by accumulating shares. Look for a confirmation on a move to the up-side above the trading range I have highlighted in blue on the weekly chart.”
  • 4/2/07: “Bottom Line: MA is rated a buy in my book and I am grabbing shares today.
    *This blog post is not a recommendation to buy this or any other stock. Please do your own due diligence and buy and sell at your own risk!”

050307_ma_daily.png

Now for the official reason why MA was up over 10% yesterday and has a 17% gain since the case study done on April 2:
First quarter earnings rose 70% boosted by higher gross dollar volume and a 19% jump in the number of transactions processed. The Purchase, N.Y., issuer of credit and debit cards and provider of a transaction authorization network reported first-quarter earnings of $214.9 million, or $1.57 a share, up from $126.7 million, or 94 cents a share, a year earlier. MasterCard said net revenue for the quarter rose 24% to $915.1 million from $738.5 million a year ago. Analysts surveyed by Thomson Financial expected, on average, earnings of $1.16 a share on revenue of $842 million.

Analyze my Calpine Trade

As I mentioned last week – I sold my shares in Calpine after the candlestick reversal on the 24th. I was more concerned with my buy in BIDU so I never had the time to write a full post about Calpine (CPNLQ) but I did make sure I mentioned that I sold my shares in that post:

BIDU buy up 30% in two Days

4/26/07: “I sold my shares in Calpine but that may have been premature (190% gain). I will buy back into Calpine if it corrects and will let you know.”

050107_cpnlq.png

The stock is getting slammed the past two days and actually reached an early intraday low of $2.95, almost a full $1 lower than my sell of $3.82 and far from the 52-week high of $4.15 made on the reversal last Tuesday. The reversal made my decision to sell on the candlestick charts!

It was an excellent trade, my best trade of the year, especially considering it was a piece of crap stock and trades below $10 per share (not my territory).

The chart shows where I bought, held and then sold – all based on technical analysis!

ISE Bought by Deutsche Boerse

Stock of the Day – UPDATE!
International Securities Exchange Holdings
Monday’s Intra-day Price: ISE – $64.71

I don’t screen many stocks on this blog but when I do, I keep them to the best; based on my research and beliefs of the market. ISE has been posted on this blog multiple times since last fall along with its sister stocks such as ICE, BOT, CME and NMX. I have made some solid trades with these exchange stocks and I know that readers have as well.

043007_ise_mswi.png

The former MSW members had tracked ISE for more than 30 consecutive weeks on the MSW Index as it traded along the major moving averages and built two consecutive cup shaped bases. All holders have been rewarded nicely with the news today.

Too bad my options are in NMX and not ISE.

If you haven’t already heard, ISE opened at $65.40 and currently trades 42% higher than it did last Friday.

Yahoo-Reuters News Story:
International Securities Exchange’s board of directors accepted a $67.50 per-share takeover offer from Deutsche Boerse, a source familiar with the situation said on Monday.

A formal announcement is expected later Monday, the source said. The deal was a friendly, negotiated transaction that emerged out a friendship between the chief executives of the two companies, the source said.

Deutsche Boerse wants to buy ISE to expand in the fast-growing global market for options trading. ISE is the largest U.S. equity options market. The companies could not be immediately reached for comment.

043007_ise_wkly.png

ISE has been highlighted in these posts over the past several months:

Weekend Trender – EDU

Stock of the Day – Updated
New Oriental Education & Technology Group Inc.
Monday’s Closing Price: EDU – $47.90

Sector: Consumer Discretionary
Industry: Education Services

042707_edu_wkly.png

The stock is still trending from my original analysis areas and has performed better than most of the Chinese stocks I have covered. It is now up about 30% from the February coverage and seems to be trending higher with a steady angled pattern.

042707_edu_daily.png

Both the 50-d moving average and the trendline I have provided can offer additional areas of accumulation. A new position should be established near the trendline and not the 50-d m.a. (it provides a more favorable risk to reward ratio).

Institutional Numbers (February Numbers):
Shares Bought last Period: 6,313,271
Shares Sold last Period: 22,600

Value of Shares Bought: $227,073,203
Value of Shares Sold: $770,637

Previous Posts on EDU:

042707_edu_orig.png