Exchange Stocks: ISE w/ ICE & BOT

Case Study
10/10/2006
ISE – International Securities Exchange Holdings Inc.

Industry: Financial Services
101006_ise_weekly.png

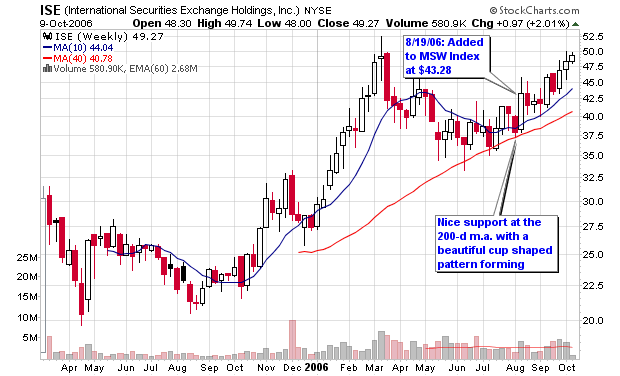
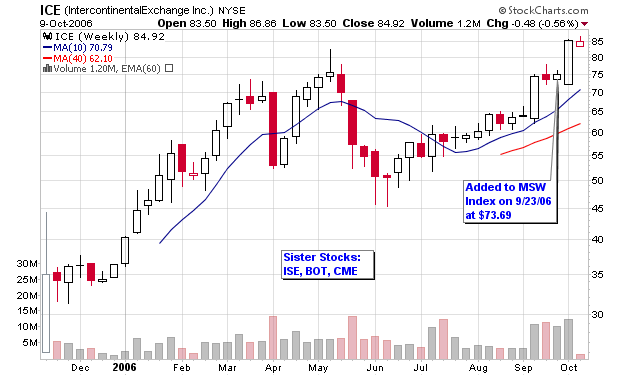
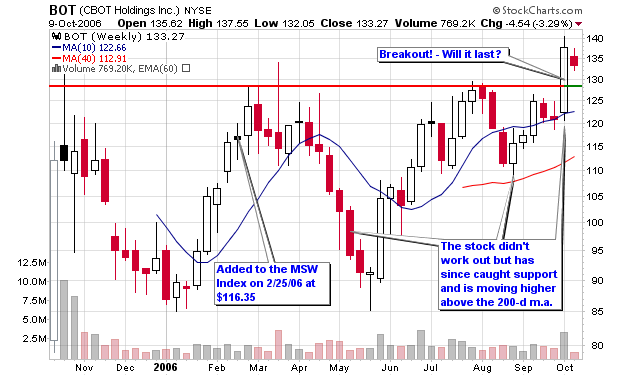
The company provides a fully electronic securities exchange for listed equity and index options. Sister stocks such as ICE, BOT and CME have been gaining strength over the past month as several of them are members on the MSW Index so I thought it would be a good time to write a case study and give them all the kiss of death (a joke of mine). I have had a history of writing case studies for stocks I own and cover that were performing nicely only to see them decline after the analysis. For example, I wrote a very detailed case study on BOT back in March (near the peak) which was uploaded to this blog earlier today. The stock corrected before rebounding over the summer and has recently blasted to new highs on above average volume. If all things hold true, this should be the top for ISE as I have just jinxed the beautiful cup shaped pattern.

Sister Stocks:
IntercontinentalExchange – ICE
Chicago Mercantile Exchange – CME (P/E: 48)
CBOT Holdings – BOT (P/E: 62)
Cash America Intl Inc. – CSH
First Marblehead Corp – FMD

Key Ratings:
Overall Rating in IBD: A+
EPS Rating: 95
Relative Price: 97
Industry Group Rank: 52 (of 197)

3-Year EPS Rate: 28%
3-Year Sales Rate: 24%

ROE: 26.53%
PEG: 1.87 (too high for my tastes!)
P/E: 36.3

EPS Analysis (yearly):
2002: 0.04
2003: 0.60
2004: 0.77
2005: 0.93
2006: 1.33 (estimate)
2007: 1.59 (estimate)

Revenue (in millions):
2002: 73.41
2003: 100.5
2004: 125.4
2005: 155.9

Net Income (in millions):
2002: 0.80
2003: 20.2
2004: 26.1
2005: 35.3

Pretax Income (in millions):
2002: 3.60
2003: 36.0
2004: 51.7
2005: 65.1

Cash (in millions):
2003: 92.9
2004: 171

Cash Flow (in millions):
2003: 21.6
2004: 30.1
2005: 41.4

Number of Institutions (last reporting period):
% Shares held by Institutions: 62%
Total Institutions: 295
Money Market: 114
Mutual Funds: 172
Other: 9

Top Institutional Holder: Bamco, Inc. (3.5 million shares) 0.02% of portfolio
101006_ice_weekly.png

Some of the fundamental causes for concern are the above average price earnings ratio versus the entire industry and the S&P 500 and the high price to book value which almost doubles the industry standard and triples the average on the S&P 500. The current price of the company must be considered a premium when compared to the industry and the market.

Does this matter?

According to William O’Neil, strong stocks must be bought at premiums just as luxury items in life are bought at premiums. Competition is moving in on the company as the profit margins are shrinking within the industry.

Moving to technical analysis, we can see that most of the stocks in the industry are moving higher and ISE is forming a beautiful cup shaped pattern that has formed over the past seven months. The top of the right side of the pattern should come to a close near $50-$52 and then form a handle in order to shake out weak holders. The 200-d m.a. has been acting as support while the right side of the base forms so look to this area as a fall-back zone if the stocks decides to correct.
101006_bot_weekly.png

Both ICE and BOT have moved on to new 52-weeks highs so ISE may be seen as the laggard but the base is great. As long as a handle forms and a pivot point is established, I will enter at the ideal time only if the “M” in CANSLIM is cooperating. The major indexes are extended so I am not sure if this will all come together at the proper time but it is a very interesting development to watch. The stock is already up over 15% in six weeks on the MSW Index so we can always take profits if things turn badly!

Piranha
Review: CBOT Holdings Case Study (March 2006)

I wrote a detailed case study on CBOT Holdings back in March 2006 and wrote a brief blog post titled Is BOT the next CME? but I picked the stock near its peak and was forced to sell. It rebounded over the summer months after it’s collapse and has recently blasted to new highs. The entire sector is acting with strength so I have decided to write another case study about ISE which will be uploaded later in the day. Note one major thing about institutional holdings: 3% of the shares were held back in March for a total of 138 institutional investors; that number has increased to 16% held with 204 institutional investors now owning shares (Scout Capital Management is now the top holder with more than 1 million shares).

Here is what I was looking at back in March 2006 with BOT:

CASE STUDY – Another successful Exchange Stock?

3/1/2006
BOT – CBOT Holdings Inc. CL A

Industry: Financial Services

Company Profile:
Cbot Holdings, Inc.. The Group”s principal activities is to derive exchange based on contract volume with global listed futures and options on futures contracts. The Group operates in two reportable segments: Exchange Trading and Real Estate Operations. The exchange trading segment primarily consists of revenue and expenses from both the electronic trading and open-auction platforms, as well as from the sale of related market data to vendors and from clearing services. The real estate operations segment consists of revenue and expenses from renting and managing our real estate. We allocate indirect expenses to each operating segment. – profile published by Ameritrade

Analysis from the first week it was added to the MSW Index (2/25/06):

Price on 2/25/06: $116.35
Buy Point: $122.00
Support: $105.00

The stock looks expensive but the market is in favor of financial stocks and especially exchanges (take a look at CME – I missed that one on the move from $60 to $425 over the past two years). The recent IPO is about to challenge the 52-week highs as it sits 13.5% from that high. I found it through a search for stocks within 15% of a new high with solid fundamentals. My Target is $175 for the next 6-12 months.

Sister Stocks:
Chicago Mercantile Exchange – CME
International Securities Exchange – ISE
Asta Funding – ASFI
Global Payments – GPN
Euronet Worldwide – EEFT

Key Ratings:
Overall Rating in IBD: A+
EPS Rating: 98
Relative Price: 87
Industry Group Rank: 27 (of 197)

3-Year EPS Rate: 25%
3-Year Sales Rate: 12%
ROE: 15.98%
PEG: 2.88 (very high)
P/E: 108.95 (cause for concern)

EPS Analysis (yearly):
2004: 0.80
2005: 1.53
2006: 2.53 (mean estimate)
2007: 3.09 (mean estimate)

Revenue: (in thousands)
2002: 308,273
2003: 381,302
2004: 380,193
2005: 466,573

Net Income: (in thousands)
2002: 34,311
2003: 30,707
2004: 41,985
2005: 76,543

Pretax Income (in thousands):
2002: 59,033
2003: 116,814
2004: 74,223

Total Assets (in millions):
2003: 483,981
2004: 460,416

Long Term Debt:
2004: 31,074
2005: 10,716

Number of Institutions (last reporting period):
% Shares held by Institutions: 3%
Total Institutions: 69
Money Market: 49
Mutual Funds: 19
Other: 1

Top Institutional Holder: Mazama Capital Management, Inc. (606,932 shares) 0.01% of portfolio

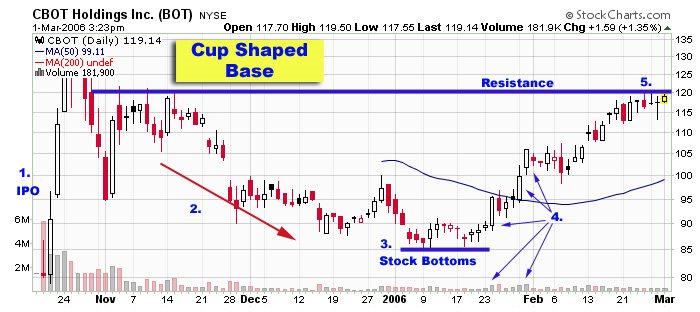
Chart Legend:

The stock debuts with an IPO in October 2005 and quickly reverses from an intra-week high.

  • A two month downtrend ensues as the stock drops on decreasing volume.
  • The stock bottoms in early January, 2006 as volume dries to it’s smallest weekly level ever
  • The next four weeks tick up with increasing volume (several accumulation weeks can clearly be seen)
  • The former resistance set near the IPO stops the stock in its track below $120.
  • A buy will take place on a strong move above $120-$122 (note how the RS line is reaching new highs)
  • Piranha

    Las Vegas Sands – LVS

    I am sure many of you have seen the latest Forbes 400 list by now but if you haven’t, take the time to read over the list and pay careful attention to an article titled :
    Another Hour, Another Million

    The article is about Sheldon Adelson, the owner and CEO of Las Vegas Sands, LVS, a long time favorite of the MSW screens in 2006. The man was worth approximately $3 billion just two years ago but his wealth has skyrocketed to more than $20 billion since taking LVS public. According to the article’s calculations, Mr. Adelson, could surpass Bill Gates as the richest man on the planet by 2012 if all variables remain relatively equal. He has earned about $23.6 million per day and almost $1 million per hour over the past two years.

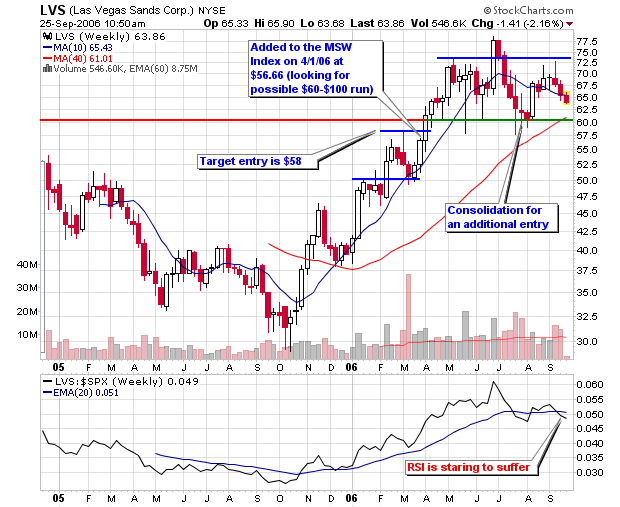
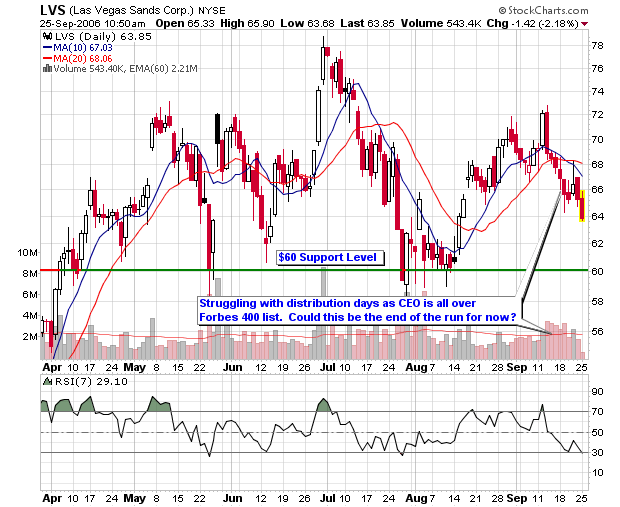
    Why does this interest me? Because I have owned shares earlier in 2006 and currently own new shares in his public company: LVS. I bought shares back in the first week of April and sold them in July as the stock took out the 50-d moving average. After catching support near $60 in July (above the 200-d m.a.), I entered once again in August but have not profited this second go-around (at this point in time). I am now even with my latest position and have become concerned with the CEO making headlines with his own article in Forbes. I have learned from past market experts such as William O’Neil, Bernard Baruch and Gerald Loeb that headlines could be the sign of trouble ahead, at least for the stock.

    Looking at the charts, my stop is near (slightly below) the support level of $60 so I will monitor the situation closely to make sure a loss doesn’t grow. I have already told a few people that a hedge to protect the down side may be warranted but the most important thing is to follow your rules and original objectives in the trade.

    I have provided some of the analysis I have posted to the MSW Index over the past six months. I selected a couple entries from each month as selecting all would take up too much space on the blog. When listed on April 1, 2006, support was placed at the 50-d m.a. with an entry at $58. This was triggered the following week and away we went! The stock was up over 37% within three months on the MSW Index before topping and consolidating over the summer with support near $60. The stock was originally added as a $60-$100 candidate and was off to the races but hit a dead summer dry spell and corrected. Time will tells us when this stock is headed!

    4/1/06: LVS makes its first MSW Index
    LVS – 56.66, The stock has been screened many times (daily) over the past several weeks so I have decided to add it after further research. The stock comes to the Index as a possible $60-$100 candidate over the next twelve months. The strong 8% move this past week gives us the feeling that the young stock is ready to move. I am also looking at the September call options (in the money calls).

    4/8/06:
    LVS – 61.41, I said I felt the stock was ready to move and I was right as I added it to the MSW Index last week. The stock gained 8.38% on above average volume as it entered the $60 trading range. I see the stock settling down and pulling back a bit before resuming the advance. Rating: Hold

    4/15/06:
    LVS – 64.10, The stock continues to move higher and maintain its quick success on the MSW Index. This was a $60-$100 play so give it time to work out and stay patient. Rating: Hold

    4/22/06:
    LVS – 63.97, A break from the action this week as the stop slipped slightly as volume was near average. The stock is extended from the 200-d m.a. so look for a new entry to form. Rating: Hold

    4/29/06:
    LVS – 64.81, Earnings come out this Thursday so be ready for that up or down swing. If numbers keep in-line with past reports, I expect the stock to beat expectations and move higher (a hard stop is advisable to protect from bad news). Rating: Hold

    5/6/06:
    LVS – 71.32, Up over 7% on Friday, bringing the weekly gain to 10% after earnings came out positive. The move was anticipated if earnings stayed in line with the past (as I noted last week). The stock is up 26% in one month on the Index. Rating: Hold

    5/13/06:
    LVS – 68.12, Down 4.49% this week as the stock holds a RS rating of 95 and remains above the most recent breakout area of $65 (our first level of support) Rating: Hold

    6/10/06:
    LVS – 65.50, The stock is trading on the 50-d m.a. and managed to gather some support when it violated the line on Thursday. The market is weak but I still have the stock targeted for the run from $60 to $100. Rating: Hold

    6/24/06:
    LVS – 66.87, Still trading along the 50-d m.a. with an upward bias. This is the type of stock that I like to buy longer term options for the possible $60-$100 run. I would look at December or January options (in the money options are best IMO). The market is weak but I still have the stock targeted for the run from $60 to $100. Rating: Entry is now for $60-$100 run

    7/01/06:
    LVS – 77.86, What can I say – the stock broke out and is powering through the $60-$100 run regardless of the overall market environment. It traded sideways for seven weeks before making a huge move this week – signs of a great stock. Rating: Final entry passed last week

    7/08/06:
    LVS – 73.81, A pullback after the breakout last week. The stock is showing support above the short term $73 level. A break below $73 will probably bring the stock back towards $70. Rating: Wait to see if it will continue pullback towards $70

    7/29/06:
    LVS – 62.77, Last week I said: “The weekly chart shows strong support near $65 as a drop below this level will bring the stock back down near $60.” As I said, the stock visited $60 and managed to close slightly above the area. Rating: the $60-$100 run has been hurt with major distribution in July but I am keeping the stock around for another week. It is does close below $60 and stay there, LVS is gone from the MSW Index.

    8/12/06:
    LVS – 60.33, Six consecutive down weeks but the weekly chart is still suggesting that buyers are starting to step back into the stock above $60. If it does close below $60 and stays there, LVS is gone from the MSW Index. Three weeks of distribution during the recent slide but a support area may be forming. Rating: Hold at current level with a sell below the 200-d m.a.

    8/26/06:
    LVS – 66.27, The stock is meeting resistance once again but has setup a double top breakout above $69 on the P&F chart. The decline last week did not qualify as distribution since the volume was below average. Still a hold in my book with the $60-$100 advance remaining a possibility as long as it trades above $60. Rating: Hold at current level with a sell below the 200-d m.a.

    9/9/06:
    LVS – 69.26, Clinging above the 50-d m.a. but volume was lighter on Friday as it moved forward by 2%. If LVS starts to struggle making higher highs, holders should become concerned. Institutional support is there but they can bail and the volume will be the story teller. Rating: Hold at current level with a sell below the 200-d m.a.

    9/23/06:
    LVS – 65.27, Sheldon Adelson has been making the news everywhere this weekend after his making a splash on the latest Forbes 400 richest list. He is the owner of LVS and has allegedly made just under $1 million per hour over the past two years. I am going to write a lengthy blog post about LVS and the appearance of the CEO all over the news. Could this be the start to a long slide? You heard it here first as I am now concerned. We all know that many stocks collapse when their CEO’s make the major news networks and magazines. Rating: Hold at current level with a sell below the 200-d m.a. I may short sell if it closes below the 200-d m.a.

    Piranha

    NewMarket Corp. (NEU)

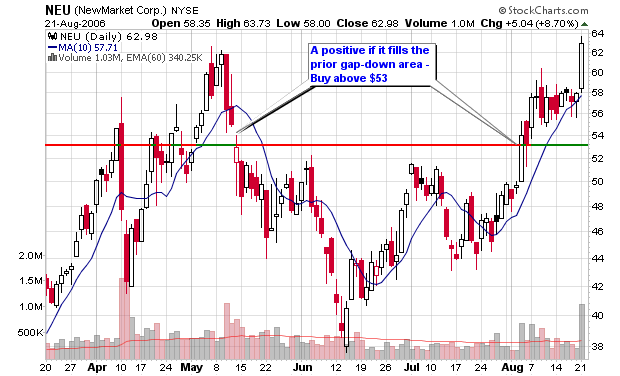
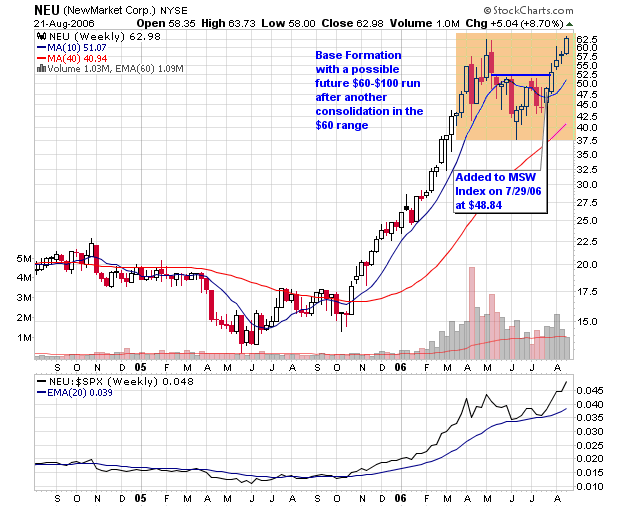
    NewMarket Corp was up almost 9% on Monday at $62.98 on volume 260% larger than the 50-day average as it closed at a new 52-week high for the first time since May. I started to screen NEU in July on the daily screens and added it to the MSW Index on July 29, 2006 at $48.84. I have pasted my analysis below from the past several weeks while on the MSW index. As you can see, my ideal entry was a move above $53 where the stock filled the previous gap-down from early May. The setup was perfect and the breakout was text-book on heavier volume.

    As I just noted, the breakout came earlier this month on heavier volume as featured on the daily and weekly screens. I don’t want to scare holders out of the stock but please remember that EZPW was up over 26% in a few short weeks and has now fallen back to even on the MSW Index. I warned to take profits in that stock and warned to never let a profit dip below 20% once it has surpassed 25% (especially in 2006). Place your hard stops in NEU so you can realize the gain if it starts to form a handle or consolidation. I wanted a new handle to form before looking for the next entry area at the new pivot disclosed this past weekend at $60.43. The stock triggered this new pivot point but did so without the handle I was looking for so I did not add new shares. I am actually looking to take profits and protect myself from any pull-back.

    I still like the chances for a possible $60-$100 run later in the year (after October) but I am wary about the action in September (a historically weak month). Looking at the institutional holdings, I can see that 113 money managers (13F), 136 mutual funds and three other holders currently own shares in the company. During the latest reporting period; 45 money markets, 32 new mutual funds and 2 banks placed new positions while only 13 institutional investors sold out. This all sounds great but the number of shares sold was basically even with the number of shares bought even though new positions eclipsed sold-out positions. The top holder during the latest reporting period was Dimensional Fund Advisors with 698,190 shares, a 13F institution (money market).

    Earnings per share have grown from $1.92 in 2004 to $2.45 in 2005 with slowing projections this year and next.

    Analysis from MSW Index:
    7/29/06

    NEU- 48.84, The stock is holding the support area noted on the watch list from two weeks ago. The buy would be a move above $53 which serves as the gap-down area. Just as stocks pull back to fill gap-ups, they breakout to fill previous gap-downs. This is the #4 rated stock on the IBD 100 Index. Rating: Buy above $53

    8/05/06:
    NEU – 53.07, The stock broke above the gap-down buy area of $53 on Thursday buy dropped on Friday to close at the level. If $53 is held early next week, this will be the ideal short term entry area (right now). The decline on Friday came on volume less than Thursday’s advance but it was slightly above the 50-day average. Rating: Buy above $53

    8/7/06: (daily screen)
    NEU – 57.50, the buy was a move above $53 as indicated on recent daily and weekly screens. The stock was up more than 8% today on volume 133% larger than the 50-d m.a. NewMarket was originally screened at $48.84 on July 29, 2006 for a current MSW gain of 18% (a total of 6 trading days)

    8/12/06:
    NEU – 56.40, The stock made the breakout from last week but did reverse near $60 on Wednesday. The strongest stock on the index at this time as it could become stronger with a move to new highs. I made a test buy last week but I didn’t buy many shares. I will sell with a move below or near $50, otherwise, I will hold. I will look to add shares on a move to new highs. Rating: Buy was above $53, more shares can be purchased on a move to new highs

    8/19/06:
    NEU – 57.94, The stock has completed the four month cup shaped pattern and should develop a handle over the next couple of weeks. I encourage a handle to form for several weeks before the next advance into the possible $60-$100 run. Rating: I am a buyer if a nice downward sloping handle forms (the pivot point is now $60.43)

    Piranha

    Update: SWN short play

    I spoke about a possible short position in SWN back in March on MSW and highlighted the chart analysis on this blog: SWN a Short?

    I said: “The short position or put options can be placed (or bought) right now but I must warn that oil is still trading above its respective 200-d m.a. Unless oil cracks $60 and breaks below its own moving average, this play may not work out. If you initiate the position, make sure you use the correct position sizing techniques and protect yourself from a move to the up-side.”

    Two things happened: oil didn’t violate $60 and is still above $70 a barrel and SWN was immediately in the red on my put options. Looking at my trade journal, this is what I wrote for the position:

    “3/15/06: SWN Sep, 2006 35 put, shares price: $31.18, option price: $6.20, looking for moving average breakdown or drop to $20”

    Monday’s price closed at $25.88 (with the options trading at $9.60 per contract), its lowest level in a year (the stock did exactly what I anticipated over the six month stretch even though it looked like a bust during the first few weeks). If this was pure stock short, I would have covered when it went against me but I never sold the options due to the longer term outlook I took (6-month window). As many of you know, I typically purchase options for stocks in the $60-$100 run with a 9-12 month time frame (many of these options double or triple within the first few months and I close the position long before the 12 month expiration). Tenaris was a great example as I closed the options above $37 (from $12) and then went on to watch them soar to $97 per contract.

    This position is one bright spot for me in the midst of everything happening in the weak market environment. These contracts are now showing a 50% profit so I will start to contemplate scaling out of the contracts and locking in gains today.

    Piranha