This “Buds” for HANS

Hansen Natural (HANS) was up over 16% today to close above $176 (an all-time high) after solid earnings and an announcement stating that the company will form a distribution agreement with Anheuser-Busch. I have written about the stock several dozens times on the MSW screens and at least a dozen times on this blog in 2006. I have personally owned the stock on two separate occasions (buying at levels that some investors thought were crazy – too high or extended). I took my first position above $66 in May 2005, even though the stock was up several hundred percent during the prior year. I sold the stock later that summer for a 50% gain due to my objective being hit (looking for a $60-$100 run).

I continued to follow the stock and watched as it built a base after a stock split. As soon as HANS broke out of the sideways consolidation, I jumped back in last November. I held the stock once again with the exact objective as I had the first time: another $60-$100 run. I was awarded with another 50%+ gain as the stock completed its second $60-$100 run in one year. After selling the stock due to another consolidation near $100, I removed it from the MSW index shortly thereafter.

I continued to cover the stock on an honorable mention list and wrote about it several times on this blog over the past two to three months. Looking back, I see that I sold too early but my objective was met so I can’t be greedy. Maybe I should have looked for a third entry into the stock as it is now worth $175 per share or $360 (pre-split adjusted from my original purchase last May). I left $75 on the table and another 75% if I bought back in above $100. If I held the stock without jumping in and out, I would now have a long term capital gain of 430%. It’s all hindsight now but the main point of this post is the fact that great stocks and highly priced stocks can go higher. HANS is now up over 1,800% since its initial breakout in May 2004. You read that right: 1,800% in two years. I managed to grab a compounded gain of slightly more than 100% and I am very happy but I think of what could have been! As soon as that thought creeps into my mind, I trash it because it’s an emotion detrimental to my overall plan.

Below is the actual analysis I gave when I added the stock to the MSW Index on May 7, 2005 and then again on November 11, 2005. HANS lived on the MSW Index for about 20 weeks and has been the number one stock on my honorable mention list for the past two months. HANS is a superstar in my eyes and I am extremely proud that I was part of its stock market history.

11/5/05:
HANS – 57.63, With the breakout from the sideways movement over the past several months, HANS is back on the weekly screens with an up-trend that is still intact going back several years using the 200-d m.a. as support – AMAZING chart.

Hansen Natural (HANS) is back on the MSW weekly screens for the first time since August 6, 2005. The stock debuted the first time at a pre-split adjusted $66.56 and lasted for 13 consecutive weeks until its final screen at $91.46 on August 6, 2005. The stock reached a weekly high of $97 while on the MSW screens and basically completed a $60-$100 run. Since August, the stock split and has been correcting in a sideways pattern. The breakout this week made us take notice on a daily screen and after further analysis, we felt is was a good idea to bring back to the weekly screens. I will be very interested to see if the stock can make another $60-$100 run, that would be a remarkable feat to accomplish two times in one calendar year.

5/7/05:
HANS – 33.28, (pre-split adjusted $66.56), we profiled the stock on the case study this week with major support down near $53. The stock boasts one of the strongest RS lines in 2004 and 2005.

I leave you with one question: Is HANS priced high or low in your opinion? Many thought is was overpriced and done last May at $66 (split adjusted $33).

Piranha
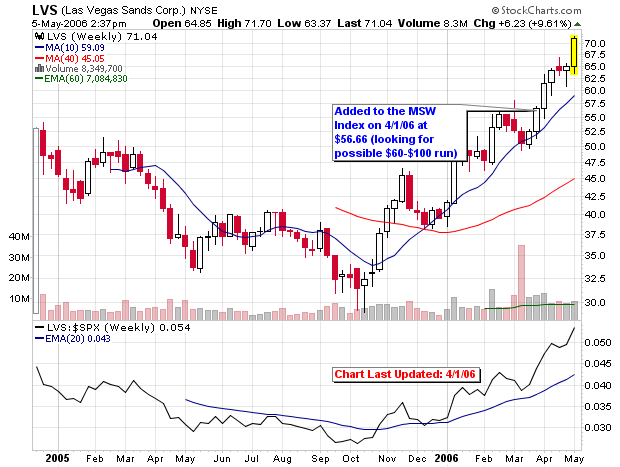
The Right Bet was with Las Vegas

Two MSW Index stocks have reported since the close of the market yesterday and we are batting .500 (one right and one wrong but I can say that we could have anticipated the one that went wrong).

Las Vegas Sands (LVS), $71.34, was up over 7% in early afternoon trading as first-quarter earnings jumped to $121.8 million, or 34 cents per share, from $7.1 million, or 2 cents per share, in the prior-year period. The year-ago results were significantly impacted by an $86.3 million loss on the early retirement of debt. Adjusted net income rose to $134.8 million, or 38 cents per share, compared to $103.1 million, or 29 cents per share, during the same period last year. LVS has now gained 26% on the MSW Index since April 1, 2006 – another successful trade.

Here is what I had to say on last Saturday’s MSW Index:
4/29/06
LVS – 64.81, Earnings come out this Thursday so be ready for that up or down swing. If numbers keep in-line with past reports, I expect the stock to beat expectations and move higher (a hard stop is advisable to protect from bad news).

This is what I wrote when the stock was added to the Index last month:
4/1/06
LVS – 56.66, The stock has been screened many times (daily) over the past several weeks so I have decided to add it after further research. The stock comes to the Index as a possible $60-$100 candidate over the next twelve months. The strong 8% move this past week gives us the feeling that the young stock is ready to move. I am also looking at the September call options (in the money calls).

By the way, these in-the-money calls were trading at $7 last month (they are trading above $17 today). A $700 contract would be trading at $1,700 in one month, a 143% gain.

LoJack (LOJN) shares are down over 11% in mid afternoon trading as the maker of vehicle-tracking devices posted an 11 percent jump in first-quarter profit, but the company’s shares are down due to concerns the company is lowering prices too aggressively. The drop should not come as a surprise to MSW members as we highlighted trouble in the chart on last Saturday’s weekly screen:

4/29/06
LOJN – 22.11, The stock is in trouble. This is one of the first 200-d m.a. plays that have violated the long term support line without making that anticipated “pop”. Volume is low so we will keep it here until May 5 – earnings day. Place a hard stop to protect against bad news. If good news hits the wire, the stock will fly! Rating: Hold

We added the stock back on March 18, 2006 but it has not materialized above the 200-d moving average as other MSW stocks have.

3/18/06
LOJN – 22.53, LoJack is another candidate added this week based on long term support at the 200-d m.a. with a trend buy opportunity right now at the current price. Buy and set a sell stop about 7-10% below the purchase price (slightly below the 200-d m.a.)

Some stocks work, some don’t and this is why we use strict money management rules to push the odds in our favor. If you bought both of these stocks, you would be stopped out of LOJN for a small loss and would be sitting tight with a solid gain in LVS. Since LVS is now above a 20% gain, you should start to think about placing a hard stop to guarantee profits if it were to reverse for some reason. I am still looking for the $60-$100 run for LVS, a move that would give the stock a 60%+ gain over time.

It’s not about winning or losing, it’s about playing the odds! Strong poker players would truly understand this philosophy.

Piranha

STRL – Sterling Construction hits Retracements

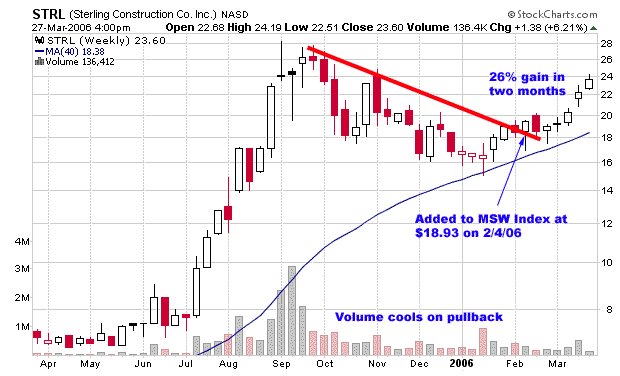
I started to cover Sterling Construction (STRL) on the MSW Index on February 4, 2006 at $18.93 as it gained support at the 200-d m.a. I purchased shares for myself at $19.05 the following week. The stock almost violated a mental sell stop but I held due to support below and have been rewarded with a 26% gain in less than two months. I wrote an extensive blog post here about price targets and retracement levels for STRL, including a chart.

In that post, I said:
“The first method to determine if the stock had bottomed is the use of the Fibonacci retracement levels (in this case, the 38.2% retracement which equals $15.46). It turns out that this retracement level also corresponds with the 200-d m.a. support and lifted the stock higher. Turning to the retracement level on the positive side, the method predicts a top at three common locations:
61.8%: $23.26
50.0%: $21.13
38.2%: $20.13”

Today’s close above the 61.8% retracement level on strong volume gives us a positive feeling about the stock. My target of $30 still exists for the year and my prior post explains where that number was derived.

Piranha

CB Richard Ellis Group, CBG, is an All-Star Stock

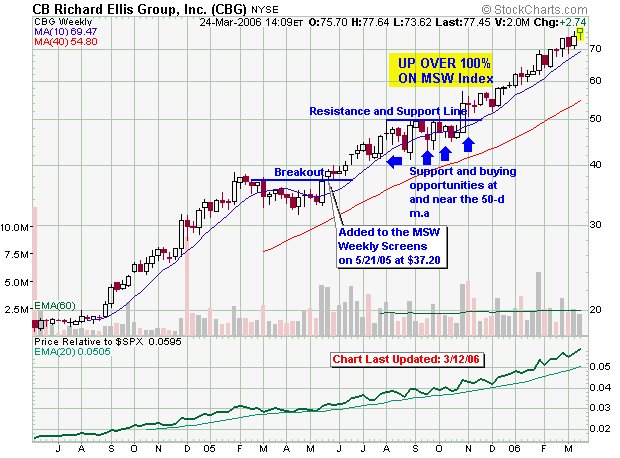
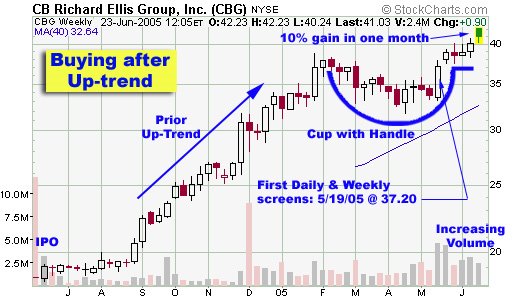
CB Richard Ellis Group, Inc. (CBG) was first screened on MSW on Thursday, May 19, 2005 at $37.22. We established a breakout and/or pivot point of $38.95 and declared a strong support level near $33.00. I instantly saw a company with great potential even though we weren’t talking about a new technology or juicy subject. The chart at the bottom of this blog post shows what I was looking at last summer as the stock started to make its run. Here is a link to a blog post I made in August 2005 after the stock was already up over 30% in 10 weeks:

CBG Blog – August 2005

The stock ran into resistance early last fall but we held tight since it wasn’t violating the 50-d m.a. with distribution days. For 13 weeks, the stock traded sideways before breaking out once again, above $50 per share. It hasn’t looked back and is trading at a new high once again today above $77 per share. The stock has made 40 consecutive weekly screens (now referred to as the MSW Index). If the stock continues to travel through the $60-$100 run, it will become a long term capital gain and those gains will be well over 100% in only twelve months without much risk along the way. Looking at the chart, we can see the slow steady growth since the original breakout in May 2005.

Keep one thing in mind: Don’t hold the position for tax implications if it suddenly started to fall. Sell immediately and take the profits because they should exceed the difference between short term and long term capital gains (if the stock tanks). If it trades sideways or better yet, continues to move higher, hold and don’t sell until we see the first set of red flag warnings.

Now I will compare the fundamental numbers I crunched in August 2005 and some new numbers I crunched earlier today:

***Note the difference in institutional supporters over the past 10 months (almost 400 new institutional holders which explains the 100% advance perfectly!***

Current Fundamental Numbers (3/24/06):
3-Year EPS Rate: 97%
3-Year Sales Rate: 40%
PEG Ratio: 1.17
ROE: 32%

Updated EPS Analysis:
2003: -0.34
2004: 0.91
2005: 2.84
2006: 3.60 (E)
2007: 4.17 (E)

Number of Institutions (last reporting period):
Total: 523
Money Mangers: 207
Mutual Funds: 296
Other: 20

August 2005 Fundamental Numbers:
3-Year EPS Rate: 65%
3-Year Sales Rate: 54%
PEG Ratio: 1.20
ROE: 22%

EPS Analysis:
2003: -0.23
2004: 1.65
2005: 2.24 (E)
2006: 2.39 (E)

Number of Institutions (last reporting period):
Total: 111
Money Mangers: 51
Mutual Funds: 56
Other: 4


Piranha

Ctrip.com (CTRP) Updated

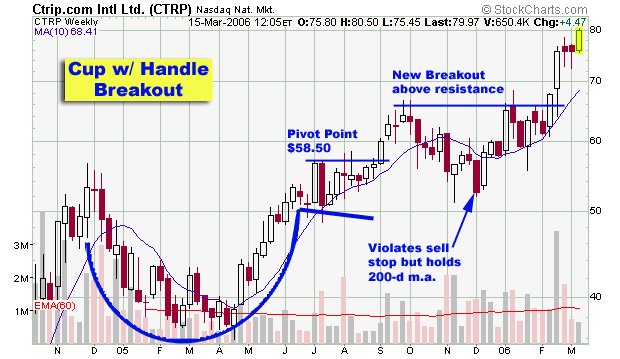
Last August (2005), I posted a case study on Ctrip.com (CTRP), a Chinese holding company that consolidates hotel accommodations and airline tickets. I listed a chart with the obvious pivot point of $58.50 on the cup with handle pattern. The stock went on to breakout but then violated the sell point forcing me to close the position. I never moved back into the stock but I can tell you that it never broke below the long term moving average support and has since gone on to make more than 35% (from the original pivot point).

The original case study is listed below with an updated chart to show you what has happened since we targeted the stock last summer. Timing is a key component when attempting to make money in stocks but cutting losses short is even more important. If you followed rules with this stock, you could have bought the original pivot point, sold for a small loss and then reentered at the 200-d m.a. or the last breakout to the up-side for the most recent gains.

Often times you will buy a stock that looks solid for the long term but buy it at the wrong time. This doesn’t mean that your stock selection was wrong; it just means that you must follow rules to eventually realize a profit (even if you are forced to sell one or more times). CTRP turned out to be a winning stock but not the way I anticipated when I added it to the MSW weekly screens (MSW Index) last year.

These are the updated institutional numbers (study them and then look at the difference from last August – numbers located below):

Number of Institutions (latest reporting period):
Total: 165
Money Mangers: 73
Mutual Funds: 87
Other: 5

New Positions: 51
Positions Sold Out: 37

ALL INFO BELOW THIS POINT FROM 8/23/05
CASE STUDY – Cup with Handle Setup
CTRP – Ctrip.com Intl ADS

Leisure Services – Transportation

Ctrip.com International, Ltd., a holding company, consolidates hotel accommodations and airline tickets in China. The company aggregates information on hotels and flights and enables its customers to make hotel and flight bookings. It also offers packaged-tour products and other travel-related products and services. The company enables its customers to choose and reserve hotel rooms in cities throughout China and selected cities abroad; book and purchase airline tickets for domestic and international flights originating from China; and choose and reserve packaged tours that include transportation, accommodation, and sometimes guided tours as well. It offers its services to customers through a transaction and service platform consisting of centralized toll-free, customer service center, and bilingual Web sites. It offers its services primarily to business and leisure travelers in China, who do not travel in groups. Ctrip.com International was founded in 1999 and is based in Shanghai, China.

CTRP has been making numerous daily screens over the past several weeks and a few “short lists” on our weekly screens. This past week, CTRP was one of the new stocks that we are watching on the weekly screen. After reviewing the fundamental numbers further and studying the chart, I decided that this stock would be best suited for a case study due to the cup with handle pattern formation.

The company smashed earning expectations in the second quarter of this year but gave a soft outlook for the third quarter. According to analysts, the company is usually hesitant when giving future expectations. Some analysts point to rising competition within the Chinese online travel industry, giving us lower expectations going forward. In any event, we can only go by past earnings numbers and current technical analysis. See our chart analysis under the “Chart Legend” section of this case study located below the fundamental breakdown of the stock.

Sister Stocks:
Ambassadors Group Inc. – EPAX
Intrawest Corp. – IDR
Bluegreen Corporation – BXG
Steiner Leisure Ltd. – STNR

Key Ratings:
Overall Rating in IBD: B+
EPS Rating: 76
Relative Price: 86
Industry Group Rank: 113 (of 197)

3-Year EPS Rate: 113%
3-Year Sales Rate: 83%
ROE: 28%
PEG: 1.13

EPS Analysis:
2003: 0.06
2004: 1.02
2005: 1.48 (E) High estimate: 1.62
2006: 1.98 (E) High estimate: 2.39

Revenue: (in millions)
2003: 173.00
2004: 334.00

Net Income: (in millions)
2003: 53.8
2004: 133.00

Number of Institutions (last reporting period):
Total: 38
Money Mangers: 21
Mutual Funds: 16
Banks: 1
Insurance Co.: 0

New Positions: 16
Positions Sold Out: 9

Chart Legend:
1. The stock started with an IPO in late 2003 with very volatile movement but then quickly started into a down-trend until bottoming out in May of 2004.
2. After a brief up-trend, the stock formed its first cup with handle base last summer and then exploded into a strong up-trend that took the stock from $34 to $55 in less than two months.
3. After the peak near $55, the stock formed our current pattern that has lasted for nine months with a nice shaped cup base and handle formation.
4. The only problem that I can see with the cup shaped pattern is the lack of strong volume on the right side of the base.
5. The handle has been forming for seven weeks with decreasing volume, an excellent sign of shaking out weak holders.
6. The pivot point was set $0.10 higher than the highest intraday high in the handle at $58.50.
7. A move above $58.50 on volume with at least 242k shares traded would qualify as a strong buy.

The general market is not healthy but some stocks tend to defy the general market trend and follow through for a breakout. The ideal situation would have the stock breaking out while the market is starting to breakout, confirming that the stock may be a market leader in the next rally.

If the stock breaks out and you buy, make sure your mental sell stop is already placed in your head or on paper. If the stock fails after the breakout and your stop area is triggered, DO NOT hesitate later date if the timing is wrong. The ‘M’ in CANSLIM is not healthy so the stock can give a false breakout.

Piranha