Can HANS do it Again?

CASE STUDY – Can HANS do it Again?
HANS – Hansen Natural Corp.

Beverages – Soft Drinks

Company Profile:
Markets, sells and distributes beverage category natural sodas, fruit juices, energy drinks, lemonades and orangeades

Hansen Natural Corporation. The Group’s principal activity is to market, sell and distribute beverage category drinks. These include natural sodas, fruit juices, energy drinks, sparkling lemonades and orangeades, non-carbonated ready-to-drink iced teas, lemonades, juice cocktails and energy sports drinks, children’s multi-vitamin juice drinks and nutrition bars and cereals. The Group also markets and distributes energy drinks under the Monster(TM) brand name. In addition, it markets nutrition bars and cereals under the Hansen’s(R) brand name. Its fruit juices for toddlers and malt-based drinks are marketed under the Junior Juice(R) and the Hard e(TM) brand names. The Group’s operations are conducted through wholly owned subsidiaries Hansen Beverage Company (‘HBC’) and Hard Energy Beverage Company (‘HEB’). The customers of the Group include, Costco, Trader Joe’s, Sam’s Club, Vons, Ralph’s, Wal-Mart, Safeway and Albertson’s. – Profile provided by Ameritrade.

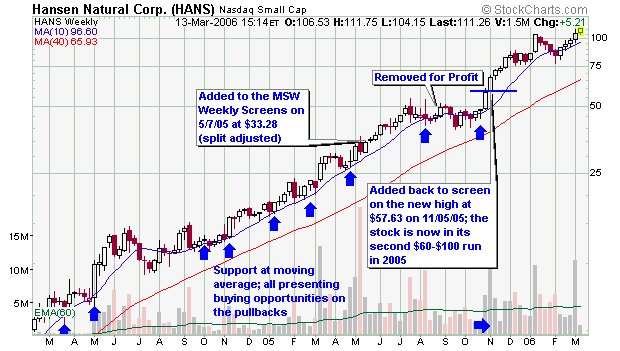
Hansen first entered my life a as $60-$100 candidate back in May 2005 before the most recent split adjustment. Using the non-split adjusted price of $66.56, HANS quickly moved through the infamous range within two months. After consolidating for another two months, I sold my shares and also removed it from the MSW Index. The consolidation period went on to form for a total of four months as the stock split 2-for-1.

After the stock split, HANS broke out once again towards the $60 range and I jumped back in and started coverage on the MSW index for the second time in one year. This time, the stock bolted from $60 to $80 in six weeks and then traded sideways for five weeks before breaking out once again and completing another $60-$100 range. A quick reversal from $100 forced me to take profits and eventually remove it from the MSW Index in January 2006. I also sold these shares due to the weakening market as told by the NH-NL ratio and the individual leaders (HANS being one of them).

Recently, the stock has been forming yet another base (8 weeks) while holding the long term moving averages. HANS broke out to a new high last week and we screened it on our daily charts and have it sitting on our weekly honorable mention list (looking for a new entry area before adding it back to the MSW Index). I have not bought back into HANS for a third time but I am looking for the opportunity. Without using the split adjusted price, I have bought shares at $66.56 and $115.26 (now I am looking to place a new position above $200 per share).

Stocks that make new highs typically continue to make additional new highs unless the trend changes! The trend hasn’t changed for this stock YET! Let’s take a look at the financials that have fueled this all-star stock over the past two years. Remember, I bought at $66 after the run-up from $15 to $60.

Sister Stocks:
Glacier Water Services – GWSV
Jones Soda – JSDA
Leading Brands – LBIX
National Beverage – FIZ

Key Ratings:
Overall Rating in IBD: A+
EPS Rating: 99
Relative Price: 99
Industry Group Rank: 41 (of 197)

3-Year EPS Rate: 178%
3-Year Sales Rate: 58%
ROE: 68%
PEG: 1.53

EPS Analysis (yearly):
2001: 0.14
2002: 0.14
2003: 0.28
2004: 0.87
2005: 2.59
2006: 3.64 (E)
2007: 4.49 (E)

EPS Analysis (quarterly):
Q1 (2004): 0.09
Q2 (2004): 0.22
Q3 (2004): 0.25
Q4 (2004): 0.31

Q1 (2005): 0.37
Q2 (2005): 0.31
Q3 (2005): 0.83
Q4 (2005): 0.75

Revenue: (in millions)
2001: 92.28
2002: 92.05
2003: 110.3
2004: 180.3
2005: 348.9

Net Income: (in millions)
2002: 3.03
2003: 5.93
2004: 20.4

Pretax Income (in millions):
2002: 5.07
2003: 9.76
2004: 33.9

Total Assets (in millions):
2002: 40.5
2003: 48.0
2004: 82.0

Key Stats in 2005:
Annual 2005 EPS: $2.59 vs. $0.87
Q1 EPS: $0.73 vs. $0.19 (not split adjusted)
Q2 EPS: $0.63 vs. $0.22 (not split adjusted)
Q3 EPS: $0.83 vs. $0.24
Q4 EPS: $0.75 vs. $0.31

Number of Institutions (last reporting period):
% Shares held by Institutions: 49%
Total Institutions: 383
Money Market: 175
Mutual Funds: 200
Other: 8
New Positions Bought: 113
Existing Positions Sold: 37
Top Mutual Fund Holder: Fidelity Low-priced Stock Fund (1.5 mil shares)

Piranha
Is BOT the next CME?

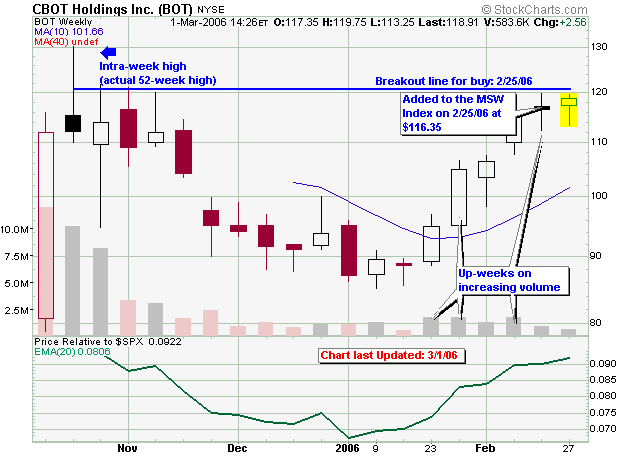
I wrote a new case study earlier today on CBOT Holdings (BOT) and realized the huge upside potential based on the lack of support by institutional sponsors in its early days on Wall Street.

The stock debuted in October and has since developed a cup shaped base without a handle (at this time) and has resistance at $120. A breakout above $120-$122 is a buy signal and the “high” price at this level should not discourage investors.

What is high to some investors may be low to others. If you question this theory, take a quick look at the multi-year chart for Chicago Merchantile Exchange (CME). That stock has moved from $60 to more than $400 in the past two years.

Here is a simple snapshot of the Institutional Sponsorship for BOT:

Number of Institutions (most recent reporting period):
% Shares held by Institutions: 3%
Total Institutions: 69
Money Market: 49
Mutual Funds: 19
Other: 1
Top Institutional Holder: Mazama Capital Management, Inc. (606,932 shares) 0.01% of portfolio

What interests me the most is the fact that only 3% of the shares on the market are held by major institutions such as money managers and mutual funds. When compared to CME, we can see that 280 money market mangers, 486 mutual funds and 24 other institutional investors currently hold positions in this stock. If BOT was to follow in the footsteps of CME, based on these stats alone, I am eager to establish a position right now! CME also has a 72% institutional sponsorship rating.

Piranha

Question about Earnings (GES)

MSW Member Question:

Hi Chris,

My name is Joe and I am a member of MSW. I have a question that I really don’t understand. I am currently holding Guess (GES) and today it has an earning CC saying earnings beat estimates by 0.08/share. However, the stock dropped 10% with 800% more volume than average. The same situation happens to LMS where it dropped 20% with great earnings. Is there something wrong with the report that I have to pay attention to? Thanks for the advice.
(Actual member’s name has been changed for privacy)

My answer:

Two things you need to understand:

  1. Current stock prices reflect actual or anticipated news and earnings from the past six months so the great earnings release today was already priced into the stock.
  2. Future expectations and earnings will be priced into the stock today after the release based on the projections. All future moves of this stock will be based on the expectations at the next earnings release (essentially, the stock price is foreshadowing the price six months from now).

In the case of your stock, Guess (GES), it crushed earnings:

Q4 EPS Increased 73% Versus Q4 Last Year, $0.57 Versus $0.33
2005 Net Earnings Doubled Over 2004, $58.8 Million Versus $29.6 Million

Fourth Quarter Highlights
– Net revenues increased 23.5% to $276.6 million
– Comparable store sales up 15.9%
– Gross margin increased 310 basis points to 42.6%
– Earnings from operations up $17.3 million to $43.4 million
– Net earnings increased 74% to $25.8 million

2005 Highlights
– Net revenues increased 28.4% to $936.1 million; comp store sales up 9.2%
– Gross margin increased 310 basis points to 40.7%
– Earnings from operations reached $101.8 million
– Net earnings doubled to $58.8 million

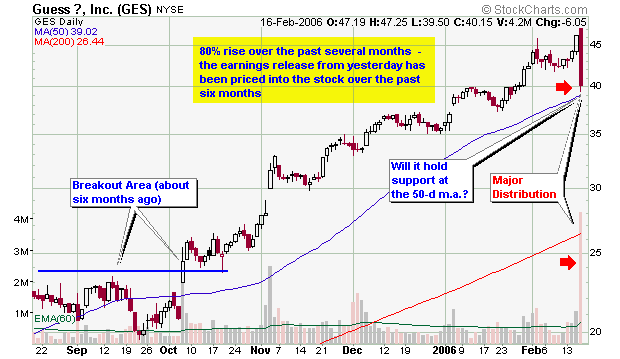
Sounds great, right? WRONG. These numbers have already been priced into the stock. The stock broke out about six months ago above $25 as shown on the chart above. That was the proper time to get into the stock as it was trading on future expectations. Stocks move ahead of the news and not on the announcement of the news unless it’s extremely positive or negative (or a complete surprise).

Thursday’s 13% drop represents future expectations of the company and not the earnings that were released yesterday (again- they have been priced into the stock over the past six months). Here is the culprit of the recent drop in price:

LOS ANGELES, Feb. 16 /PRNewswire-FirstCall
Guess? Inc. today reported record financial results for the fourth quarter and fiscal year ended December 31, 2005. Net revenue and net earnings for the quarter and the year were at their highest levels since the Company went public in 1996.

Guess Inc. shares declined Thursday after the jeans and fashion retailer warned of moderated first-quarter sales growth. Stock of the Los Angeles-based company fell $6.05, or 13 percent, to close at $40.15 in heavy trading on the New York Stock Exchange.

For the first quarter, Guess expects same-store sales, or sales at stores open a year or more, to rise 10 percent. The company expects overall sales to rise in the mid-teen percentage range, a slower rate of growth than in the last couple of quarters.

Wall Street had expected revenue of about $249.6 million, about 16 percent higher than revenue of $215.6 million in the prior first quarter.

On a conference call, Chief Operating Officer Carlos Alberini noted the snowstorms in the Northeast and the occurrence of Easter in April in 2006, rather than in March a year earlier, would hurt comparisons.

For the month of March, for example, Alberini expects same-store sales to be “nearly flat,” according to a transcript provided by Thomson StreetEvents. For the second quarter, the company expects same-store sales growth of 10 percent.

******************
As you can see, the current price drop reflects future growth and expectations and they seem to be flat so investors grabbed their profits and ran. The stock did manage to close above the 50 day moving average and it will be interesting to see if it holds support above this line (it has since the breakout above $25). The minute investors heard that the stock will not meet analysts expectations, they sold and ignored the great news from last year because they know that those profits have already been made.

An old Wall Street saying goes like this:
“Trade the rumors and sell the news”

Six months ago, the rumor was that this company was going to beat earnings expectations so investors started to buy. Now the rumor states that they won’t beat expectations, so they sold the news!

Piranha

MSW Index Top 20 Stocks from 2005

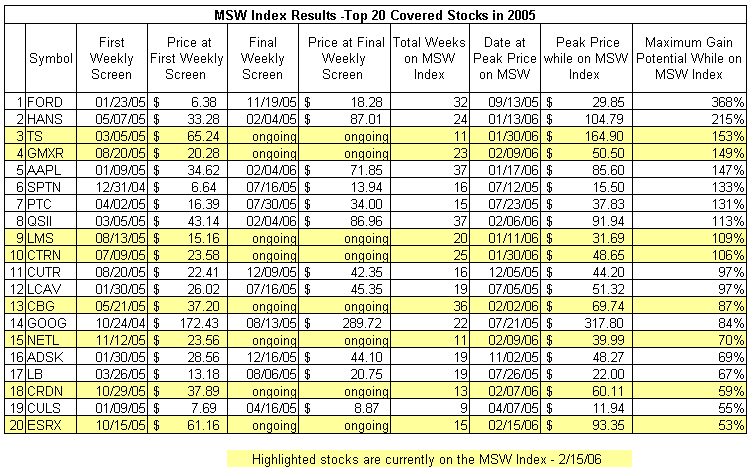
I have started to compile the complete results of the MSW Index and the MSW weekly screens throughout 2005 and have developed the top 20 list for your viewing on the blog. Click the picture at the bottom of this page to view the chart of the top 20 stocks from 2005. You will notice that 8 of the top 20 stocks are still active on the current MSW Index and several of the stocks with coverage initiated during 2005, ended their runs in recent weeks.

In the coming days, I will be uploading an exclusive page to MarketStockWatch.com that highlights the top stocks throughout the year, the worst stocks picks throughout the year, the ratio of winners to losers on the Index, our top shorting opportunities last spring and other important information about the stocks we covered in 2005. The next lists to appear on this blog will be the top shorts of 2005 and MSW’s biggest busts in 2005.

– As you all know, every trader has many busts throughout the year but the greatest traders learn to sell these stocks before they do further damage. As for the MSW Index; any stock that drops 10% from the initial coverage point is automatically cut!

Enjoy,
Chris Perruna “Piranha”

p.s. – Notice how many of the top stocks were covered week in and week out for 20 or 30 weeks (many consecutively) as they made their huge advances to profitability. (make sure the image opens to full size to read it properly)

All Good Stocks Come to an End

…Last night, I officially removed Urban Outfitters (URBN) from the MSW Index and the weekly screens for the first time since January 9, 2004. Yes, just short of two years on this website (we only started to publish our screens on MSW in 2004). I was screening URBN on Richdad.com and Investors.com throughout 2004 before I had my own established community on the web. My screens can be found under the username “piranha526” on both forums.

Over the past few weeks, I have started to get the feeling that URBN was losing strength and was starting to turn. I can’t say that I knew it would slice through the 200-d moving average (a support line it has not sliced for two plus years) but I did see that is was starting to change the way it was trading. This past Saturday (12/10/05), I said this on the MSW Index:

“this stock may be seeing its last days on the MSW Index ($30.28)”

Well, several days later, it was removed at $26.51, still representing a very respectable 164% gain since it was first covered. On Saturday, the stock was still holding a 200%+ gain on MSW from early 2004 and reached a peak gain of 236% when the latest 52-week high was set at $33.77 a few weeks back.

I stuck with the stock in September and October when it challenged the 200-d m.a. but it never sliced the line the way it has this week. The violation of the long term support on above average volume was an instant sell signal with no questions asked. When something as uncharacteristic as this happens in a stock that has been trading above the moving average, you sell and you sell quickly to lock in all profits if you have not done so already. This action tells us plain and clear that the situation has changed and the stock is ready to move in another direction. There is a chance that it can come back but don’t sit and wait to see if it will. Get out, get your profits and wait and move on to another opportunity.

This was what I wrote last night on the daily screen:

URBN – 26.51, last Saturday, I said this: “this stock may be seeing its last days on the MSW Index ($30.28)” and today, this was confirmed. This is the first break below the 200-d m.a. in this type of fashion in years. Sell and lock in profits! Urban is the second stock this week to be removed from the MSW Index.

I will be preparing a case study on URBN, guiding you through all of our analysis over the past two years. The stock made several dozen weekly screens since 2004 (possibly 100+ daily screens) and gave members multiple opportunities to produce profits in this stock. The recent drop may be foreshadowing to a weak holiday retail season. I don’t know if this is why but come back and see what the news is all about in a month or so. The technicals always give you the story before it breaks! The key is to act now and find out later! Watch your other retail positions very closely.
Piranha