Rochester Medical (ROCM)

Stock of the Day
Rochester Medical (ROCM)

Monday’s Closing Price: ROCM – $15.28

Sector: Health Care
Industry: Health Care Supplies
52-week Price: $6.85 – $29.76

The company develops, manufactures and markets a line of latex-free and PVC-free urinary continence and urine drainage care products. Eight of the past eleven quarters have reported higher earnings than the same period from the previous year.

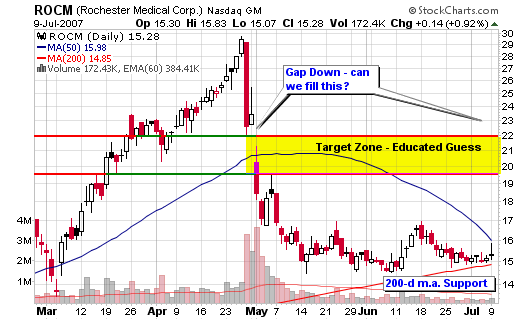
The stock is not covered by many analysts and is thinly owned by institutional investors as you can see below. Add this to a small float and we have a stock that can pop at any time just as it did earlier this year. Based on the trade setup I presented yesterday, I have decided to develop two daily charts that explain the potential price targets in greater detail. The first chart shows a target zone based on the gap-down area from late April and early May. Can the stock trend higher and fill this gap? If so, we have a nice 50% gain on capital invested and a solid cash increase based on risk (potential 7R trade).

071007_rocm.png

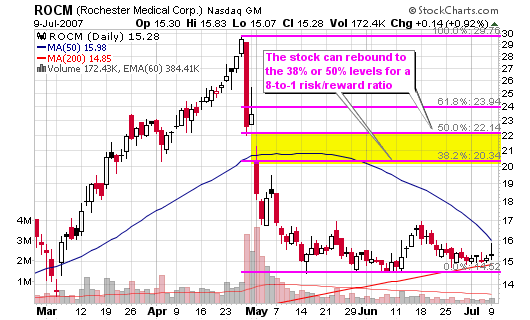
The second chart overlays Fibonacci retracements and shows an identical target zone based on the 38.2% and 50% retracement levels. None of this is an exact science but it gives us an educated guess as to where the stock could move if it starts to trend or even pop. The stock is trading between the 50-d and 200-d moving averages and looks to be trading sideways in a suspicious manner. I have no idea what is going on after the huge run-up and breakdown earlier this year but I like the risk-to-reward setup. This is what I wrote yesterday when I first screened the stock:

Late Buy Opportunities:
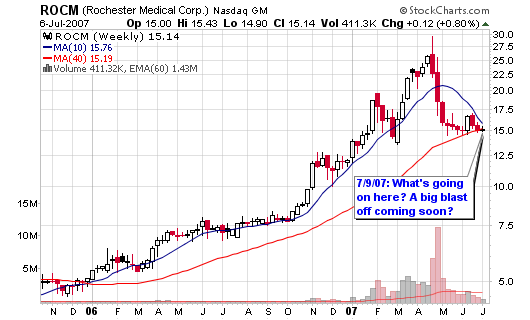
“Rochester Medical (ROCM) has had one heck of a year as it blasted higher from $7.50 to as high as $29 in six months of time. Since the peak, the stock has corrected by 50% over the past two months and is now trading with a suspicious quietness above the 200-d moving average. Is there some type of news that will be released that will propel this stock higher? I don’t know but the trade setup is ideal so take it. Something may be going on behind the scenes so take the nice risk-to-reward setup.”

071007_rocm_fib.png

Institutional Analysis:
Held by Institutions: 21%
Money Market: 40
Mutual Fund: 15
Other: 1

New Positions: 27
Positions Sold: 2
Shares Held: 2.7 mil
Shares Held Previous Period: 2.1 mil

Shares Bought: 1.5 mil
Shares Sold: 0.9 mil
Value of Shares Bought: $22.7 mil
Value of Shares Sold: 14.1 mil

Top Institutional holders, Shares Held:
Oberweis Asset Management Inc., 413,650 shares
Dimensional Fund Advisors Inc., 281,774 shares
Allianz Global Investors of America L.P., 200,000 shares
The Vanguard Group, Inc., 166,467 shares
Bridgeway Capital Management, Inc., 152,800 shares

[Read more…]

Late Buy Opportunities

The four stocks highlighted today are all trading slightly above their 200-day moving average after making some type of a correction over the past couple of months. I call them late opportunities because they were correcting when the majority of the market leaders were making new highs. This type of action could allow us to label them as laggards but their overall weekly charts would suggest otherwise.

They have all managed to trade above their long term 200-d moving average while showing us a history of success. It may be my belief and your belief that the market is near a top but do we really know when the market will officially top and start to trend lower.

I don’t think so!

So, take the trades since they have ideal risk-to-reward setups. What is the worst that can happen? You sell for a small loss. Big deal because this has been one profitable year so take the trade! These stocks aren’t the market leaders but you may be able to squeeze some profits out of the current moving average setups. We’ll call them lazy summer buys.

AllianceBernstein (AB) was one of the more consistent performing stocks on the MSW Index prior to me shutting down the index in March. The stock was screened heavily last summer and I started coverage on the 29th of July, 2006 at $66.90. The stock gained as much as 40% while on the index but has recently traded slightly downward as it makes a correction towards the 200-d m.a. It tested the line last summer and that is when I saw an ideal buying opportunity so I am now looking for a similar situation. It held the long term moving average as support last week so I would not have a problem taking a position.

(AB) Potential Trade Set-up:
Ideal Entry: $84 to $86 (currently $90.14)
Risk is set at 1.0% maximum of total portfolio or $1,000 of $100k
Stop Loss is 9% or $82.03
Number of Shares: 123
Position Size is $11,112
Risk is $8.11
Target is $108
Risk-to-Reward is 2-to-1

***The ideal entry would be near $84 for a risk to reward of 7-to-1. The stop loss would be 3% or $81.48 with a stop of $2.52.

070907_ab_wkly.png

Rochester Medical (ROCM) has had one heck of a year as it blasted higher from $7.50 to as high as $29 in six months of time. Since the peak, the stock has corrected by 50% over the past two months and is now trading with a suspicious quietness above the 200-d moving average. Is there some type of news that will be released that will propel this stock higher? I don’t know but the trade setup is ideal so take it. Something may be going on behind the scenes so take the nice risk-to-reward setup.

(ROCM) Potential Trade Set-up:
Ideal Entry: $15 (currently $15.14)
Risk is set at 1.0% maximum of total portfolio or $1,000 of $100k
Stop Loss is 5% or $14.25
Number of Shares: 1,333
Position Size is $20,000
Risk is $0.75
Target is $21
Risk-to-Reward is 8-to-1

070907_rocm_wkly.png

Click through to see the ideal trade setups for CHINA and GMKT:
[Read more…]

Recent IPO Updates

The stocks below show you why jumping on a young growth stock during an up-trend will give you great odds of success regardless of your system or beliefs. As long as you position size correctly and locate your stops, things will work out. Four of the five stocks have made double digit gains over the past three weeks while one (SMOD) has dropped 5% but may be setting up the ideal risk-to-reward opportunity near the moving average.

JASO (up over 50%) was also among the young stocks covered in early June in this post: Fresh IPO Ideas

SNCR – Synchronoss Technologies, Inc. – $34.25 (up 25%)
Earnings Analysis:
$0.35 – Last Year Primary EPS
$0.56 – Current Year Mean Primary Estimate
$0.72 – Mean Primary Estimate — Next Year
28.75% 5-YEAR GROWTH MEAN EPS

Institutional Analysis:
Total Held by Institutions: 156
Money Market: 70
Mutual Fund: 82
Other: 4
Shares Held: 16.86 mil
Shares Held Previous Period: 13.48 mil
Shares Bought: 8.94 mil
Shares Sold: 5.56 mil
Value of Shares Bought: $220.27 mil
Value of Shares Sold: $136.99 mil

070607_sncr_wkly.png

GTLS – Chart Industries Inc. – $30.07 (up 30%)
Earnings Analysis:
$1.04 – Last Year Primary EPS
$1.60 – Current Year Mean Primary Estimate
$2.09 – Mean Primary Estimate — Next Year

Institutional Analysis:
Total Held by Institutions: 121
Money Market: 59
Mutual Fund: 59
Other: 3
Shares Held: 15.73 mil
Shares Held Previous Period: 15.54 mil
Shares Bought: 2.72 mil
Shares Sold: 2.53 mil
Value of Shares Bought: $59.52 mil
Value of Shares Sold: $55.31 mil

070607_gtls_wkly.png

DVR – Cal Dive Intl., Inc. – $17.80 (up 15%)
Earnings Analysis:
$1.91 – Last Year Primary EPS
$0.61 – Previous Year EPS
$1.53 – Current Year Mean Primary Estimate
$1.70 – Mean Primary Estimate — Next Year
20.00% 5-YEAR GROWTH MEAN EPS

Institutional Analysis:
Total Held by Institutions: 110
Money Market: 59
Mutual Fund: 46
Other: 5
Shares Held: 25.59 mil
Shares Held Previous Period: 16.88 mil
Shares Bought: 12.89 mil
Shares Sold: 4.17 mil
Value of Shares Bought: $195.31 mil
Value of Shares Sold: $63.25 mil

070607_dvr_wkly.png

SMOD – SMART Modular Technologies Inc. – $13.62 (Down 5%)
Earnings Analysis:
$0.68 – Last Year Primary EPS
$0.50 – Previous Year EPS
$0.91 – Current Year Mean Primary Estimate
$1.06 – Mean Primary Estimate — Next Year
17.50% 5-YEAR GROWTH MEAN EPS

Institutional Analysis:
Total Held by Institutions: 149
Money Market: 82
Mutual Fund: 62
Other: 5
Shares Held: 42.33 mil
Shares Held Previous Period: 25.68 mil
Shares Bought: 18.82 mil
Shares Sold: 2.17 mil
Value of Shares Bought: $269.36 mil
Value of Shares Sold: $31.08 mil

070607_smod_wkly.png

Happy Fourth of July!

I am updating my stats for the second consecutive month to show readers my appreciation of your continued support for my work. The site grew by double digits for the sixth consecutive month since launching chrisperruna.com in December.

070407_hits.png

I’d also like to remind everyone that the charts you see on this blog are updated daily in real time with their annotations. Don’t forget about my research and charts just because a blog post is no longer on the front page. I continuously update these charts on my stockcharts page.

They can be seen through this link: chrisperruna.com Annotated Stockcharts

My list currently contains 95 charts that are relevant to my current macro market research and each individual stock I follow.

Feel free to visit my public stock charts list and definitely vote for it if you enjoy the work I am doing. The link is always posted on the right side bar of this blog. I don’t get anything for the vote except a smile for work well done!


070407_fireworks.jpg

BIDU and Chinese Friends

Baidu.com (BIDU) has been a phenomenal holding and one of the strongest leaders among the Chinese stocks. I have watched, researched and jumped on this trend and will remain there until it ends.

070307_bidu_daily.png

070307_bidu_wkly.png

New Oriental Education & Technology Group (EDU) has been one of the more consistent Chinese stocks with a great business model and a product in demand.

070307_edu_wkly.png

JA Solar Holdings, Co. (JASO) is fairly new to the blog and my research but has become an instant superstar with fabulous gains over the past three weeks. The stock is now up 51% and I have increased my trailing stop to guarantee a 40% gain (up from a 30% locked-in gain last week).

070307_jaso_daily.png

Mindray Medical International (MR) hasn’t been as successful as EDU but it is showing a 29% gain over the past five months. If I had to cut one Chinese stock from my portfolio, it would be this one as it is the slacker compared to the holdings above.

070307_mr_wkly.png

Be careful with these stocks but don’t ignore a hot trending market. Many thought the Chinese boom was killed months ago but don’t listen to these talking heads. Jump on the trend, ride it, lock in gains or cut losses if you are wrong. You can’t make money if you don’t play the game.

Don’t let your so-called “rational” mindset prevent you from buying a trending stock because it looks too high or seems to be near the end of a trend. Trade your system signals, not your emotions and turn off that TV set and stop reading crappy opinionated stock market blogs. Stick with reading the best blogs that present unbiased data (as unbiased as they can be); the ones that don’t pollute their pages with opinions and garbage beliefs. My blogroll contains some of the best blogs out there for new ideas and research.

You and I don’t know when that trend will end so play the risk-to-reward ratios and you will be fine. If another Chinese JASO comes along next week, I will buy, regardless of the length of the recent boom. Until the leaders fall, I am playing.

Finally, make sure you have hard physical stops (trailing stops) to capture these gains in case a quick pullback or correction does take place.