Stock of the Day – UPDATE!
Intercontinental Exchange
Thursday’s Close: ICE – $136.54
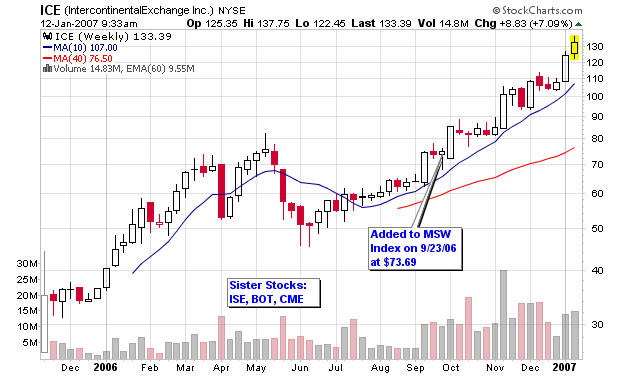
I have screened ICE multiple times on the blog since October along with its sister stocks (ISE and BOT) and have also screened it every week since September 23, 2006 on the MSW Index. ICE was first screened on the MSW Index at $73.69 with the analysis quoted below.
MSW Index on September 23, 2006:
ICE – 73.69, Added to the MSW Index as a sister stock of ISE as the stock is a new IPO from late 2005 with a new base forming. Earnings are up, the index is making money, new products are launching and traders are everywhere. The long term prospect of this stock looks healthy as does the entire group which gets a B on IBD. Rating: the next buy is a move above $78 on the P&F chart
MSW Index on September 30, 2006:
ICE – 75.07, The stock was up 1.87% for the week after falling hard on Monday. The pivot point is set at $78.02 on the weekly chart and $78 on the point and figure chart. Rating: the buy above the pivot requires volume of at least 2 million shares (daily)
MSW Index on October 7, 2006:
ICE – 85.40, Eight of the last nine days have been higher as the stock gained a whopping 13.76% on big time volume. The stock was up 1.87% for the week after falling hard on Monday. The pivot point set last week at $78.02 on the weekly chart and $78 on the point and figure chart was blasted through with great success . Rating: the buy above the pivot happened with qualifying volume on Wednesday
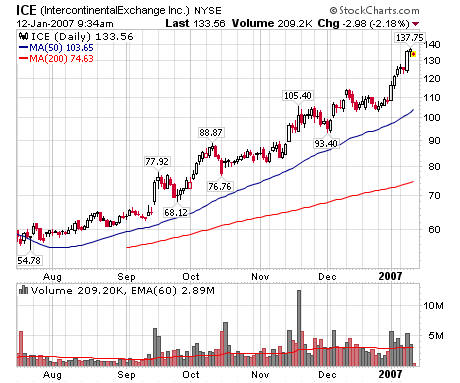
Since these first few weeks of coverage, the stock has given investors an 85% return and I have continued to analyze the movement as it has made the MSW Index for 15 consecutive weeks. This Saturday will mark the sixteenth straight week of coverage as ICE has become one of the top performers in the MSW Index in a relatively short period of time.
Most recently on the blog, ICE was highlighted in an update post titled, ICE, BOT and ISE Updated,
when it’s price was trading at $108.10 on December 11, 2006.
The original case study was written on October 10, 2006 in a post titled, Exchange Stocks: ISE w/ ICE & BOT, when the stock was trading at $84.92.
Next Earnings Date: 2/22/2007
Sector: Finance
Industry: Financial-Misc Services
IntercontinentalExchange operates the leading electronic global futures and OTC marketplace for trading energy commodity contracts, including crude oil and refined products, natural gas, power and emissions. ICE conducts its markets for futures trading through its regulated subsidiary, ICE Futures, Europe’s leading energy futures and options exchange. ICE also offers a range of risk management and trading support services, including cleared OTC contracts, electronic trade confirmations and energy market data. ICE globally distributed liquid electronic markets, ICE offers a range of risk management tools designed to increase trading efficiency. Electronic trade confirmations through ICE eConfirm ensure that trades are confirmed accurately and in a matter of seconds, whether executed in ICE’s OTC markets or off-exchange. The combination of speed, accessibility, service, and information makes ICE the complete energy marketplace for thousands of market participants across the globe, around the clock.
Held by Institutions: 74.45%
Number of Institutions:
Money Market: 176
Mutual Fund: 190
Other: 8
Top Holder: Sands Capital Management, Inc.
7 mil Shares for 0.04% of Portfolio
Total Equity Value of Portfolio: $19.0 billion
Key Fundamental Numbers:
Market Cap.: $7.8B
Short Ratio: 1.32
Operating Margin: 57.45
Net Income $M: 109.14
ROA (%): 42.13
ROE (%): 47.00
P/E (TTM): 67.75
P/E (Forward): 38.45
Price to Sales Ratio: 27.56
Earnings per Share (EPS) (TTM): 1.763
Book Value per Share: 6.66
PEG Ratio: 1.70 (this is too high for me)
Price to Book Ratio: 18.73
Next Quarter 0.74
Next Year 2.33
Earnings:
Yearly (2006): E2.33
Yearly (2005): 0.39
Yearly (2004): 0.41
Yearly (2003): 0.37
Yearly (2002): 0.37
2006:
Q1: 0.33
Q2: 0.52
Q3: 0.73
Q4: E 0.74
Revenue (millions):
Yearly (2005): 155.9
Yearly (2004): 108.4
Yearly (2003): 93.70
Yearly (2002): 125.0
2006:
Q1: 73.59
Q2: 73.59
Q3: 94.66
Q4: —
Net Income:
2005: 40.4
2004: 21.9
2003: 13.4
Cash Flow:
2005: 55.5
2004: 38.9


ICE has done well for me. I didn’t own it when you first initiated coverage, but I did manage to get into it ~80. You’re right though, it has been an all-star performer. That’s two of the last three stocks you’ve profiled that I own, but I think that’s it for me. The rest of my portfolio is pretty mundane.
Terry,
The problem with me was I was focusing too much on ISE rather than ICE. I could have hit a huge home run if I focused more on ICE! I love the industry as I now have a nice position in NMX.
That’s an interesting one. I don’t know that much about it other than it went public very recently. Good luck with it.
I agree with you on the industry, though. It’s been fantastic. While ISE and BOT have been okay, I think my second choice would be NYX.
Terry,
I like NYX also but don’t own shares at this point in time.