SandRidge Energy (SD)

I screened a stock on Monday named SandRidge Energy (SD) in a post titled, My Latest Stock Watchlist and noted that it made just about every screen I ran over the weekend. I looked back at scans from earlier in the year and it did make a few of them but didn’t grab my attention until now.

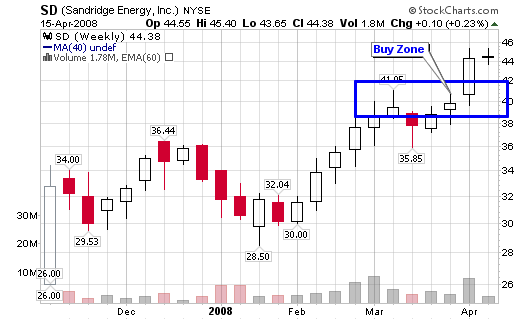
SD – 44.28, made almost every screen I ran this week (buy near $40)

041607_sd_wkly.png

Stock of the Day
Sandridge Energy Inc. (SD)
Monday’s Closing Price: YGE – $44.38

Sector: Oil & Gas
Industry: Oil and Gas Production
52-week Price: $28.50 – $45.40

SandRidge is an independent natural gas and oil company with its principal focus on exploration, development and production activities. The Company also owns and operates drilling rigs and a related oil field services company with focus on exploration and exploitation of its significant holdings in West Texas. SandRidge operates in four segments: exploration and production, drilling and oil field services, midstream gas services and other.

The stock recently logged a new all-time high on increasing volume as it broke-out above the ideal entry area of $41.15. Unfortunately for me, it broke out during the week of my vacation (and return). I can’t say that I would have bought shares but I am interested now. I understand that crude is selling at all-time highs and some people are calling for a top but I am not about to listen to them. Money is still to be made in this industry. By the way, SandRidge is in the #1 rated industry group as produced by Investor’s Business Daily.

Net income was 137% higher than a year ago (3rd quarter) with revenue increasing by 71% during the same time period. Natural gas and crude-oil production jumped nearly five-fold. Shares closed at $31.20 ahead of the 3rd quarter report; it has since given investors a 40%+ gain in a few months.

SD is starting to outperform a few of the top stocks in the top rated industry group, something I do make note of. For example, SD is up 24% YTD as the industry groups as a whole is up 18% YTD. As you will notice, SD shares company with some very respectable names (stocks).

Sister Stocks (Top Rated Industry by IBD):
Range Resources Corp – RRC
Continental Res Inc. – CLR
Quicksilver Resources – KWK
Bois D’Arc Energy LLC – BDE
Petrohawk Energy Corp – HK

Potential Trade Set-up:
Ideal Entry: $41.15
Risk is set at 1.0% of total portfolio or $1,000 of $100k
Stop Loss is 10% or $37.04 (breathing room to $36 is okay)
Number of Shares: 243
Position Size is $10,000
Risk is $4.12
Target is $55+ (based on future growth)
Reward-to-Risk is 3.36-to-1 with ideal entry; less with current price

Continue reading to see the impressive institutional numbers, general fundamental numbers and basic technical analysis that make this stock stand above other recent IPO’s. Net income, revenue, earnings and industry (global) growth make this an ideal stock for my watchlist. I am looking for young companies with increasing earnings and sales.

[Read more…]

VISA (V) set to Launch

Visa Inc. (V) is set to launch the largest initial public offering in U.S. history on Wednesday but I doubt it will do much to help this market (from a bullish standpoint). The company is offering 406 million shares with an anticipated price between $37 and $42, according to SEC filings.

In total, the IPO could raise nearly $17 billion, surpassing the record held by the AT&T Wireless IPO from 2000 which raised $10.6 billion. The $15 to $17 billion projection is approximately 70% higher than what the market was reporting when I was anticipating this IPO last November.

“VISA, the largest U.S. credit card network said it is looking to raise $1o billion in an initial public offering, according to a registration statement with the SEC.”

JPMorgan (JPM) is one of the lead underwriters (Goldman Sachs is the other) so the market wants this IPO to launch successfully so additional fears don’t rise following the $2 Bear Stearns fire sale. A successful IPO would generate a large cash influx to banks such as JPMorgan, Bank of America and Citigroup. Visa’s IPO could generate around $500 million in fees for underwriters, according to documents with the SEC.

Shares will price after the close Tuesday with lots ready to move Wednesday morning.

As pointed out in my last post, Visa and Mastercard (MA) are not directly exposed to rising defaults and late-paying consumers because they process transactions and these transactions typically rise when credit is tight from banks. American Express and Discover are not as fortunate in this sense as they extend the credit to their card holders, exposing themselves to the defaults.

As you can see, Mastercard (MA) has held up very well during this credit crisis. It has not violated it’s major moving averages and is still in an overall long term up-trend.

031708_ma_wkly.png

November 15, 2007: Anticipating the VISA IPO

Why do I like VISA’s potential?

  • $1o Billion would represent the second largest IPO ever!
  • Revenues are expected to grow steadily as consumers continue to use their cards
  • VISA processed 44 billion transactions totaling $3.2 trillion in 2006 (Mastercard processed 23.4 billion transactions totaling $1.9 trillion)
  • VISA has made $771 million on $3.7 billion in revenue during the first nine months of 2007
  • VISA makes their money from the fees it charges to card users and merchants using its network
  • Mastercard is half the size of VISA and is up 5-fold from its IPO

BEST OF ALL:

  • Because it acts as an intermediary, Visa doesn’t sustain losses when consumers don’t repay the debts run up on credit cards bearing its brand. Those liabilities instead fall to the banks that issue the cards and set the terms of repayment
  • Most of Visa’s major stockholders are banks. They include: J.P. Morgan Chase & Co., which owns 23.3 percent of the company’s Class B Stock; Bank of America Corp., 11.5 percent; National City Corp., 8 percent; Citigroup Inc., 5.5 percent; U.S. Bancorp, 5.1 percent; and Wells Fargo & Co., 5.1 percent.

NO RISK for VISA; the banks are responsible for the cardholders that don’t pay their bills. What could be better than that? Tell me!

Gushan (GU) Making a Move

I wrote about “The Next Chinese IPO – GU” on Wednesday, December 19, 2007 and consider it the first unofficial “stock of the day” of 2008. The stock was up 18.27% on volume 252% larger than the average; the largest volume spike since the stock’s IPO debut.

020508_gu_daily.png

Fools like Cramer and CNBC said the stock was under the radar until today but readers here have known it was out there and has potential in the upcoming year. It touches upon a few hot topics and stock drivers from the past couple of years: energy, china and IPO’s. Three categories that are not unfamiliar on this blog (especially in 2007). It does scare me that Cramer (profit jinx) mentioned Gushan today but I will ignore the superstitions and continue to follow the stock while grabbing shares.

A second firm from Wall Street decided to initiate coverage on the stock with a buy recommendation. I labeled the stock a buy the day it debuted and maintain that analysis based on my fundamental and technical research:

“The Next Chinese IPO:
Now it’s time to jump on the next IPO that’s about to debut on New York Stock Exchange under the symbol “GU”. Chinese biodiesel fuel producer Gushan Environmental Energy Ltd. (GU) said it plans to raise about $171.6 million in an initial public offering of American Depositary Shares (ADS).”

Earnings Estimates:
FY 2007: $1.02E
FY 2008: $1.52E +49%
FY 2009: $2.00E +31%

Revenue (in millions):
2002: 5,258
2003: 10,422
2004: 23,793
2005: 49,840
2006: 113,891

Net Income:
2002: 2,080
2003: 5,361
2004: 10,245
2005: 21,069
2006: 45,972

PEG Ratio: 0.77x
P/E Ratio: 38.49

Why the surge today? The stock seemed to be following a surge in the Shanghai market.
Another stock of related interest higher today: YGE, up 13.38% on volume 60% larger than average66666666666666666666666
66666666666666666666666
66666666666666666666666
66666666666666666666666
66666666666666666666666
66666666666666666666666
66666666666666666666666
66666666666666666666666
66666666666666666666666
66666666666666666666666
66666666666666666666666
66666666666666666666666
66666666666666666666666
66666666666666666666666
66666666666666666666666

Yingli Green Energy Holding Co. (YGE)

Stock of the Day
Yingli Green Energy Holding Co. Ltd. (YGE)
Monday’s Closing Price: YGE – $32.24

Sector: Technology
Industry: Semiconductor (Solar)
52-week Price: $10.48 – $41.50

010708_yge_wkly.png

As I said last night, the stock took a hit to end last week on heavy volume which concerns me but corrections are healthy. A pullback to the mid $20’s could be possible based on the prior pullback in October and November. I am looking to add shares based on institutional numbers alone (which are listed below). Approximately 10 million more shares were bought than sold for an estimated “plus” $400 million during the last reporting period.

We had 47 new positions established while 3 positions were sold out (about 15.6-to-1 ratio of buyers to sellers). The float is 25% of the outstanding shares and the market capitalization is more than $4 billion which puts this stock in the bull’s-eye of major institutional investors.

Volume is averaging about 5 million shares traded per day and increasing as each month passes. The ideal entry is somewhere in the mid-$20’s range or slightly above the prior pullback area of $22.50.

This stock has triple digit potential and could be a leader come year’s end. If the opportunity presents itself: trade it and follow the rules! If it fails, sell! It’s that simple.

Sister Stocks (Top Rated Industry by IBD):
FSLR – $236.84
STP – $74.96
SOLF – $31.78
JASO – $68.05

Potential Trade Set-up:

[Read more…]

Highest Rated IPO’s

Today’s post takes a snapshot view of the top ten rated IPO’s to start 2008 according to my fundamental screeners and research. You will be familiar with many of the names as they have been covered on the blog throughout 2007. They still stand at the top of the list of market leaders in this area. The names may be getting old but they still work and working in this business means money.

NOTE: this does not mean they are instant or current buys, it just means that they carry the strongest fundamental ratings that I follow.

What ratings do I use?

  • IPO debut after January 1, 2006
  • Increasing quarterly earnings
  • Increasing yearly earnings
  • Increasing sales and revenue (quarterly and yearly)
  • Top relative strength ratings versus S&P 500
  • Market Capitalization of at least $100 million
  • Current price greater than $10 per share

I’ll make a brief comment about each stock and let you know what I see while analyzing their charts as of Friday’s close. The stocks are listed based on overall fundamental ratings (not technical).

Top Ten Rated IPO’s

  • FSLR – First Solar Inc., $245.58
    The chart looks to be craving a correction, one similar to the pullback in July 2007 which watched the stock give back more than 37% (from $119 to $74). I would only be inclined to add shares near the 50-d and/or 200-d moving average.
  • SNCR – Synchronoss Technologies, Inc., $33.42
    The stock is correcting back to the 200-d m.a. for the second time in as many months. The ideal accumulation area is now. The trade may not work but it’s a game of odds. A green light for a buy!

010608_sncr_wkly.png

  • JASO – JA Solar Holdings, Co., $71.86
    The stock is extended from all important longer term moving averages. Accumulation can take place along the 50-d m.a. (currently near $61). The stock has never tested the 200-d m.a.; a correction to this level would be drastic but telling long term (in years).

010608_jaso_wkly.png

[Read more…]