Gafisa SA (GFA)

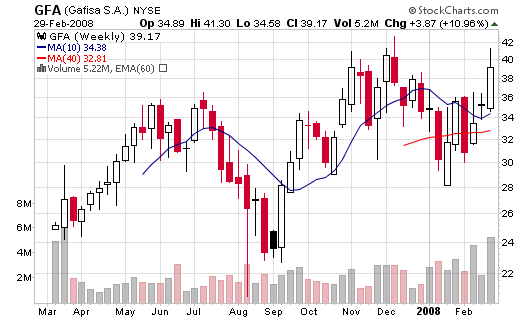
Gafisa closed 8.35% off-of its all-time high Friday as the Dow Jones dropped 316 points (2.51%), the NASDAQ fell 60 points (2.58%) and the S&P joined the party by shedding 37 points (2.71%). Quarterly earnings are expected to be released Tuesday, March 4, 2008.

Fewer new positions were established than sold but $142.9 million more shares were purchased than sold during the last reporting period. However, things don’t look as rosy when searching through the financials as cash from operations and investments are sinking while cash from financing is increasing. Net income took a step back, earnings estimates look poised to drop but total revenue is increasing.

030208_gfa_wkly.png

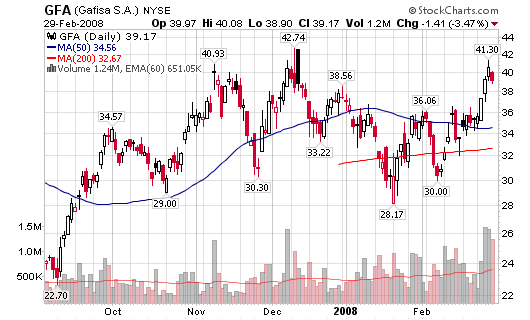
I first started noticing GFA on my daily screens on December 3, 2008 at $37 and then profiled it again a week later on December 10, 2008.

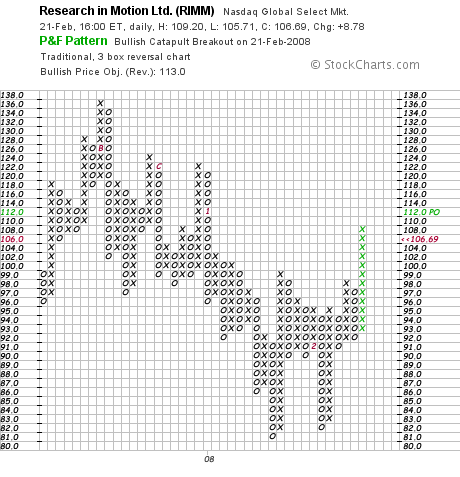
GFA – 40.50, a spread triple top breakout on the P&F chart; the stock made a new high on the daily and weekly charts on above average volume (volume was 258% larger than the average on Friday). Screened last week at $37.00.

I read that Cramer has been pumping the stock so don’t buy the recent surge (sell to his sheep; short term), especially since the overall market is hurting. GFA is one stock that I will be looking to grab shares in if the market can show any strength in the future. Brazil has been going through a period of growth that is allowing the middle and lower class citizens to purchase homes which could lead to continued success for the company. In addition, billionaire entrepreneur Sam Zell owns 14% of the stock through his private equity firm.

Institutional Numbers:
Total Held by Institutions: 99
Money Market: 57
Mutual Fund: 40
Other: 2

New Positions: 23
Positions Sold: 30
Shares Held: 25.8M, +3.6M
Shares Held Previous Period: 22.2M

Shares Bought: 5.9M
Shares Sold: 2.3M
Value of Shares Bought: $233.6M
Value of Shares Sold: $90.7M

030208_gfa_daily.png

[Read more…]

Is Big Blue Back (IBM)

We all know IBM gave investors an excellent return last year versus previous years but can the stock continue to move higher. Is this the new and improved sustainable Big Blue?

022608_ibm_wkly.png

International Business Machines (IBM) has been making some of its largest gains of the past ten years, starting at the end of 2006. Not since the late 1990’s has the stock enjoyed this type of run with volume support which translates into a positive accumulation/ distribution rating.

IBM went from a split adjusted price of $9.67 in 1993 to $132.52 at its peak in the 1999 bull market. It corrected to $51.77 in 2002 before trading sideways for the next four years. Something clicked in late 2006 and the stock ran-up from $70 to a high of $120.57.

IBM closed at $114.38 Tuesday night, a 5.84% gain on volume 98% larger than the average. The stock crossed back above the 40-week (200-d) moving average while also jumping back above the shorter term 50-d moving average. An ascending triple top breakout has also flashed on the point and figure chart.

Next stop: Is it a new multi-decade high which signals a buy?

Institutional Numbers:
Total Held by Institutions: 2,947
Money Market: 1,357
Mutual Fund: 1,472
Other: 118

New Positions: 288
Positions Sold: 125
Shares Held: 1.26 Bil
Shares Held Previous Period: 1.23 Bil

Shares Bought: 116.2 Mil
Shares Sold: 89.5 Mil
Value of Shares Bought: $12.14 Bil
Value of Shares Sold: $9.36 Bil

26.7 million new shares have been bought (versus sold)
$2.8 billion new dollars have flowed into the stock

So what does IBM do these days?
IBM’s business comprises three principal business segments: Systems and Financing, Software and Services.

[Read more…]

Stocks Catching my Eye

Three stocks are catching my eye while making multiple screens over the past couple of weeks. MTL is up over 13% in less than two weeks since I highlighted it in a post titled Basic Materials (Oil) Stocks Making New Highs

MTL – 111.60, Mechel Steel Group was up 10.60% on volume 97% larger than the daily average

Trading momentum is paying-off in the current market environment. Swing trading breakouts making new highs on volume at least 100% larger than the average is king. It’s working so pay attention and be smart while putting on trades. MTL is no longer a buy since it has become extended but TITN and RIO may be setting up for new 52-week highs.

022408_titn_daily.png

022408_titn_wkly.png

022408_rio_wkly.png

022408_mtl_wkly.png

RIMM is my Pick

I choose Research in Motion Ltd. (RIMM) as my stock for the ibankcoin.com 2008 March Madness stock tournament after reading about it on Rajin’ Cajun’s blog (formerly known as Madstocks blog). It’s all in good fun as I typically avoid contests because they make me do things I might not do otherwise (like trade and root for a stock based on a pick rather than reality).

I picked RIMM for several reasons:

  • I don’t own shares at this time so I can be objective
  • Q4 ends on March 1, 2008 with a reporting date of April 2, 2008 (spans contest)
  • The chart is currently bullish (daily and weekly)

We’ll see how I do. A blow out earnings date that hits the wire early gives me great odds and the market is always about odds (I looked at this competition from a poker player’s perspective rather than a pure investor/ trader). The odds are strong for good news prior to the official earnings release in April.

I thought about going short, with several stocks in mind, including Chipotle Mexican grill (CMG) but figured I historically do better with long positions. The market in general will be a huge influence during the contest. A down market will severely hurt my chances to win.

Recent Posts with RIMM highlighted:

022108_rimm_wkly.png

022108_rimm_daily.png

022108_rimm_pnf.png

CMG starting to look like CROX

The weekly chart of Chipotle Mexican Grill (CMG) is starting to breakdown in a similar way that CROX broke down but the institutional numbers don’t support the down side as strongly as it did with CROX. The number of shares sold exceeded the number of shares bought by 46% when I highlighted CROX as a potential breakdown stock back in September in the post titled “Will CROX get Eaten?”

“Recent churning action below $60 per share shows that buyers are no longer in control of the stock. However, sellers haven’t completely gained control either. It is a tug-of-war between supply and demand as we await the ultimate direction of the next trend for the heavily covered Crocs Inc. (CROX).”

021808_cmg_wkly.png

The difference here is that CMG has only recorded a 19% increase in shares sold versus shares bought which is not excessive. However, the stock has violated the 200-d moving average for the first time since the long up-trend started. We can also see the first violation of the relative strength versus the S&P 500 suggesting that the stock is no longer a leader and may fall victim to increased institutional selling.

Yes, the current fundamentals look strong but CMG posted a fourth-quarter profit that missed Wall Street’s expectations and said 2008 would remain challenging, raising some red flags in my opinion. They could be playing it cautious or they could be signaling the beginning of the end of this particular run.

The stock is 32% off of its all-time high and has been falling on increasing volume as it violated the long term moving average. I am not shorting at this spot but I will jump on puts about six months out on the first failed attempt to make new highs above the 200-d m.a.

Listen to what the Institutional Buyers are Saying (with their actions):
Total Held by Institutions: 386
Money Market: 182
Mutual Fund: 200
Other: 4

New Positions: 107
Positions Sold: 58
Shares Held: 29.28 mil
Shares Held Previous Period: 30.12 mil

Shares Bought: 4.31 mil
Shares Sold: 5.16 mil
Value of Shares Bought: $554.8 mil
Value of Shares Sold: $663.9 mi

  • The number of shares held has decreased by 3%
  • The number of shares sold exceeded the number of shares bought by 19%
  • The value of shares sold was $109 million more than bought

It took a couple of months but CROX did get Swallowed and it all started with the small and subtle red flags that we are starting to see with CMG.

“I wrote a post titled Will CROX get Eaten? on September 20, 2007 and strongly noted the declining institutional support (see numbers below). Someone was jumping out of the stock and we now know why!”

“Stocks only churn when buyers and sellers are struggling to take control. More often than not, stocks churn because BIG institutions are selling shares to the small retail buyer (the sucker). Institutional numbers and charts that back them up don’t lie! The big boys can’t hide if you know how to read them.”

021808_crox_daily.png