Petrochina (PTR) Climax Top?

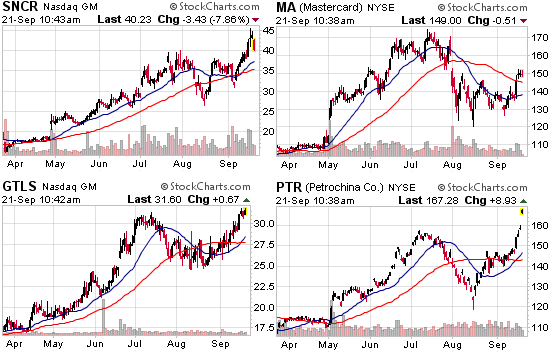
Are we watching a climax top in Petrochina (PTR)?

If so, now is the time to dump shares and protect profits. So, you don’t want to dump them all; then sell half or at least a third of your position.

092507_ptr_daily.png

I have been taught to always sell all of a stock that has a climax top – this is where the stock has advanced for many months and suddenly races up for one or two weeks much faster than any prior one- or two-week period or since the beginning of the stock’s long move up). Petrochina is currently experiencing a dramatic push unlike any of the previous tops it has made over the past couple of years.

Another rule I follow explains that you should sell when your stock exceeds an upper channel line drawn across three price peaks over a period of many months on a weekly chart. We can clearly see that PTR is now violating the upper trend channel after it touched three prior price peaks.

092507_ptr_wkly.png

I can’t tell anyone what to do and I don’t want to either but I love presenting what I see based on technical analysis. PTR was a buy for me in February but I now see it as a sell.

What do you see?

Leading CP Stocks

The top ten “stock of the day” case study stocks on chrisperruna.com in 2007 have an average gain of 59%.

FYI: since I am writing this post with some intensions of bragging, SELL! I am only slightly kidding because it could be a sign that we could be nearing a top (if I brag). When stock bloggers brag, the party will start to end soon enough. When we get cocky, cover your positions on the first signs of red flags!

092107_stocks.PNG

With more than two dozen “stock of the day” case studies, the entire group is up more than 27% for the year. And this includes SMOD which is down 48% and JSDA which is down 30%. Both SMOD and JSDA would have been sold based on the trade setups (risk-to-reward) but I’ll leave the portfolio “as is”.

  • BIDU tops the list with a 171% gain since 4/25/07
  • The top four gainers on the list are all Chinese related
  • Five of the top ten are from China
  • 13 of the 24 stocks are in positive territory (54% winning percentage)
  • *When you see a trend, jump on it! China was the trend and it has paid handsomely!

Top 10:
1. BIDU: 171%, $103.50 to $280.56, 4/25/07
2. JASO: 70%, $24.55 to $41.65, 6/13/07
3. MR: 67%, $24.95 to $41.55, 1/30/07
4. EDU: 56%, $36.93 to $57.48, 2/2/07
5. SNCR: 51%, $27.88, $42.20, 6/13/07
6. MA: 40%, $107.28 to $150.20, 4/2/07
7. GTLS: 37%, $23.05 to $31.54, 6/13/07
8. PTR: 35%, $123.38 to $166.34, 2/5/07
9. SLW: 33%, $10.48 to $13.91, 1/3/07
10. ROCM: 28%, $15.14 to $19.37, 7/10/07

Bottom 5:
1. SMOD: (48%)
2. JSDA: (30%)
3. SHLD: (26%)
4. HWCC: (19%)
5. MFB: (17%)

092107_stocks_02.PNG

Will CROX get Eaten?

Are we about to jump on a falling star or is this a slight hiccup for the former super star?
I labeled CROX a rising star that I missed in my own portfolio back on June 25, 2007 in Catch a Rising Star.

Recent churning action below $60 per share shows that buyers are no longer in control of the stock. However, sellers haven’t completely gained control either. It is a tug-of-war between supply and demand as we await the ultimate direction of the next trend for the heavily covered Crocs Inc. (CROX).

092007_crox_wkly.png

I wrote this on my Daily Screen on Friday, September 7, 2007:

CROX – 58.40, the stock seems to be hitting some resistance near $60 but that is quite normal in this area. Look for a pullback of 10%-20% with support above the 200-d m.a. If is holds the support, develop a strong risk-to-reward trade setup and pounce with a possible $60-$100 run in the future.

It has been eight weeks of sideways action as CROX did not participate in the party that happened on Wall Street after the Fed announcement. Stocks such as BIDU continued to party while CROX has decided to take a breather.

So, what do I think? Don’t listen to me because I am biased and hate the look of those ugly shoes. I hate them even more since I never owned the stock while it ran up more than 300% over the past twelve months.

Listen to what the Institutional Buyers are Saying (with their actions):
Held by Institutions: 557
Money Market: 241
Mutual Fund: 304
Other: 12

New Positions: 172
Positions Sold: 75
Shares Held: 104.9 mil
Shares Held Previous Period: 118.1 mil

Shares Bought: 28.5 mil
Shares Sold: 41.7 mil
Value of Shares Bought: $1.68 bil
Value of Shares Sold: $2.46 bil

So, there you have it. It starts off by looking good with 97 more buyers than sellers. But, the rest of the data doesn’t paint such a bright picture:

  • The number of shares held has decreased by 12%
  • The number of shares sold exceeded the number of shares bought by 46%
  • The value of shares sold was $776 million more than bought

Someone is getting off this rising star! Now, the question remains: Will this former rising star turn into a “thing of the past” falling star? CROX looks like a fad to me because the shoes are hideous but they make a TON OF MONEY! I am no longer confident about a long position but I CAN’T take a short point of view either. Not until the signal bell rings! If it confirms, JUMP ON IT – IN EITHER DIRECTION!

WE TRADE TRENDS, NOT OPINIONS SO LOOK FOR THE SIGNAL!

Make Millions Trading IPOs

Gain 59%, 50% and 34% in three months or less trading IPOs.
Does this sound too good to be true? Well, if I was writing a headline to some bogus guru seminar, this is what I would start with. It probably caught someone’s attention!

The gains above are real for the small group of IPOs I have been covering heavily since June 13, 2006, starting with Fresh IPO Ideas.

I am not an investing guru but I do provide high quality equity research and stock education that offers everyone a chance to develop trading skills and the confidence to make money. The stock group below has given us an 80% success rate with the average gain above 38% in a few short months. More importantly, take a look at the changes in their institutional sponsorship over the past three months and you will see a direct correlation between that and their share prices.

Three Month Results:

  • JASO, 59.63% gain
  • SNCR, 50.65% gain
  • GTLS, 34.75% gain
  • DVR, 9.15% gain
  • SMOD, 49.41% loss

Aside from SMOD, the other IPOs have performed phenomenally over the past three months with JASO and SNCR leading the way. Below is a comparison of the institutional numbers reported in June and what is showing on my screen today.

JASO – JA Solar Holdings, Co. Ltd. – $39.19 from $24.55
Institutional Analysis:
Total Held by Institutions: 125 from 87
Money Market: 75 from 68
Mutual Fund: 49 from 18
Other: 1 from 1
Shares Held: 15.90 mil from 15.16 mil
Shares Bought: 5.56 mil from 13.51 mil
Shares Sold: 4.87 mil from 0.19 mil
Value of Shares Bought: $180.79 mil from $314.6 mil
Value of Shares Sold: $156 mil from $4.58 mil

**JASO has gained more than 59% while institutional sponsorship has increased 44%. The number of shares held has only increased by 5% with institutions buying less than one million shares more than they were selling. I would prefer to see more institutional sponsorship as the price of the stock moves higher. JASO must penetrate the levels from July and go on to set new all-time highs.

091807_jaso_wkly.png

SNCR – Synchronoss Technologies, Inc. – $42.00 from $27.88
Institutional Analysis:
Total Held by Institutions: 202 from 156
Money Market: 86 from 70
Mutual Fund: 111 from 82
Other: 5 from 4
Shares Held: 26.59 mil from 16.86 mil
Shares Bought: 14.20 mil from 8.94 mil
Shares Sold: 4.28 mil from 5.56 mil
Value of Shares Bought: $531.25 mil from $220.27 mil
Value of Shares Sold: $160.3 mil from $136.99 mil

**SNCR has gained more than 50% while institutional sponsorship has increased 29%. Even better, the number of shares held has increased by 58% with institutions buying 10 million more shares than they were selling (3.5-to-1 ratio). It all makes complete sense as the stock has soared to new highs. This will stay on my list long term.

091807_sncr_wkly.png

GTLS – Chart Industries Inc. – $31.06 from $23.05
Institutional Analysis:
Total Held by Institutions: 187 from 121
Money Market: 97 from 59
Mutual Fund: 85 from 59
Other: 5 from 3
Shares Held: 31.8mil from 15.73 mil
Shares Bought: 18.75mil from 2.72 mil
Shares Sold: 2.51 mil from 2.53 mil
Value of Shares Bought: $486.9 mil from $59.52 mil
Value of Shares Sold: $65.2 mil from $55.31 mil

**GTLS has gained almost 35% while institutional sponsorship has increased 55%. The most attractive number of the group is the jump in shares held for GTLS which increased by 102%. Institutions bought 16 million more shares than they were selling for an 8-to-1 ratio. The value of shares bought closed just shy of $500 million while the value of shares sold was only $65 million. The stock looks good long term.

091807_gtls_wkly.png

[Read more…]

Chart Industries (GTLS)

Stock of the Day
Chart industries (GTLS)
Friday’s Opening Price: GTLS – $29.49

Sector: Industrial Goods
Industry: Metal Fabrication
52-week Price: $31.37 – $11.16

Chart Industries (GTLS) was first featured on June 13, 2007 at $23.05 as a Fresh IPO Idea. The stock had 121 institutional supporters at the time, a number that has increased 54% to 187 with a large influx of cash. Almost $500 million of shares have been purchased in the most recent quarter while only $65 million shares were sold, a sure sign of institutional accumulation. The number of shares held has doubled from 15.73 million in June to 31.82 million today.

This is the type of activity that I like to see in a young growth stock that is currently building a cup shaped base after a prior uptrend. It has been making recent daily screens and is currently on the top of my potential buy list. I don’t own shares as I write this analysis but I will be looking for a handle formation to jump into a position. The ideal trade setup is located below with proper position sizing and risk-to-reward margins based on a moving average (swing) trade (not a cup with handle because a handle hasn’t formed).

091407_gtls_wkly.png

GTLS was Featured in these posts in June 2007:
6/13/07: Fresh IPO Ideas, GTLS – Chart Industries Inc. – $23.05
6/20/07: Young Guns Taking Off, GTLS – $24.73

Institutional Analysis:
Total Institutions: 187
Money Market: 97
Mutual Fund: 85
Other: 5

New Positions: 86
Positions Sold: 13
Shares Held: 31.82 mil
Shares Held Previous Period: 15.59 mil

Shares Bought: 18.75 mil
Shares Sold: 2.51 mil
Value of Shares Bought: $486.9 mil
Value of Shares Sold: 65.2 mil

Top Institutional holders; Shares Held:
Capital Research and Management Company; 2,266,400
Gendell, Jeffrey L.; 1,686,400
Delta Partners LLC; 1,629,840
Smallcap World Fund; 1,613,500
Neuberger Berman, LLC; 1,318,500

Potential Trade Set-up (moving average setup – not cup w/ handle):
Ideal Entry: $28.00
Risk is set at 1.0% maximum of total portfolio or $1,000 of $100k
Stop Loss is % or $25.76
Number of Shares: 446
Position Size is $12,500
Risk is $2.24
Target is $38
Risk-to-Reward is 4.46-to-1

*The target is an educational guess based on the depth of the cup shaped pattern*
[Read more…]