Intercontinental Education – The 20% Rule?

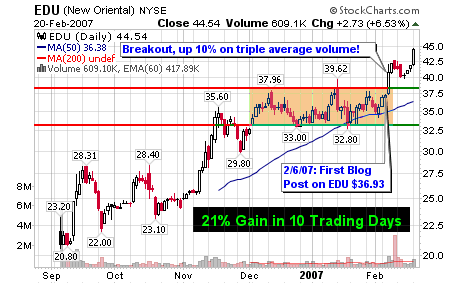
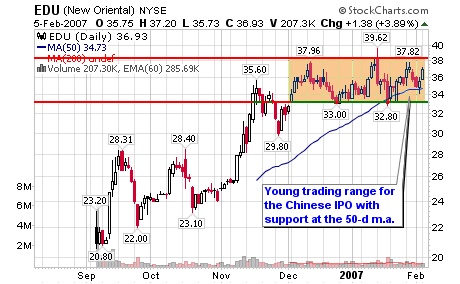
Do we have a new superstar in the making with the explosive 20% gain in ten days for New Oriental Education (EDU)?

022107_edu_daily_sm.png

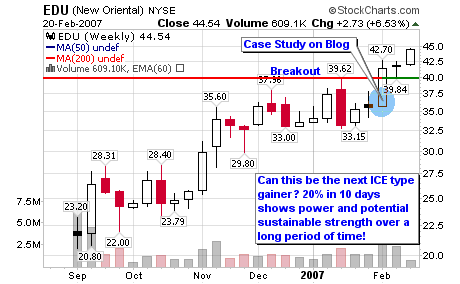
Intercontinental Exchange (ICE) blasted higher by 20% or so back in late September and early October of last year before consolidating for five weeks. I wrote a detailed case study on the exchange stocks at this time (ICE, ISE and BOT). So far, ICE and BOT have worked while ISE is struggling but gaining some support along the 200-day moving average in recent weeks.

William O’Neil of Investor’s Business Daily suggests holding a stock for at least eight more weeks if it gains 20% or more this quickly. If you held ICE, you would now have a 120% gain in five months and it all started with that quick 20% weekly gain.

022107_ice_weekly_sm.png

EDU was my stock of the day a couple weeks back and has leaped higher by 21% in two weeks. Is this a sign of things to come or just a quick buck that needs to be realized? Whatever the case, set a retracement stop and ride the trend to new highs. Institutional sponsorship is amazing as highlighted in this case study:

Learning about New Oriental Education (EDU) 2/6/07.

Someone is accumulating shares and I want to take the ride with them (I’m the small guy holding on for dear life). If the ride stops, I’ll jump off and move on to the next ride!

022107_edu_weekly_sm.png

EDU Institutional Numbers:
Shares Bought last Period: 6,313,271
Shares Sold last Period: 22,600
Value of Shares Bought: $227,073,203
Value of Shares Sold: $770,637

Additional related Links:
EDU Breakout on Huge Volume! 2/7/07

Intercontinental Exchange (ICE) is HOT 1/12/07

ICE, BOT and ISE Updated 12/11/06

Exchange Stocks: ISE w/ ICE & BOT 10/10/06

Bullion or Beef?

Stocks of the Day: BKC & JADE
Two interesting stocks appeared on my research screens last night for MSW. One stock is being accumulated on heavy price and volume action while the other is a young IPO that looks ready to breakout to new all-time highs. One stock is a household name and has been around for more than 50 years while the other stock in basically unknown from Hong Kong.

Our beef stock (if we can call it that), Burger King Holdings, Inc. (BKC), through its subsidiary, Burger King Corporation, engages in the franchising and operation of fast food hamburger restaurants. Burger King also offers soft drinks and other food items. As of August 23, 2006, it operated approximately 11,000 restaurants in 65 countries worldwide. The company was founded in 1954 and is headquartered in Miami, Florida.

021607_bkc.png

Not quite bullion but LJ International, Inc (JADE) engages in designing, branding, manufacturing, marketing, and distributing fine jewelry. The company specializes in the semiprecious jewelry, as well as offers pieces set in yellow gold, white gold, platinum, or sterling silver and adorned with semiprecious stones, diamonds, pearls, and precious stones. Its product line includes earrings, necklaces, pendants, rings, and bracelets. The company distributes its products principally to fine jewelers, department stores, national jewelry chains, and electronic and specialty retailers throughout North America and Western Europe, as well as in Japan and the People’s Republic of China. LJ International was founded in 1987 and is based in Hung Hom, Hong Kong.

021607_jade.png

Neither stock is the greatest in the world but they are both interesting based solely on their current charts. BKC has been trading sideways over the past two months with strong price and volume action over the past week. A move to new highs (all-time) on above average volume would be positive and signals an ideal entry opportunity. The fundamentals are what they are: average.

As for JADE, it’s a lower priced stock that I typically steer clear of but I can’t ignore the huge surge in price and volume over the past several weeks. The stock had doubled in price on volume 3-6 sixes greater than the average. It looks extended to the average investor and I am not jumping on at this point because the fundamentals don’t support the position but I am interested if the stock consolidates and offers an entry area. A stock with this much interest is going somewhere based off of some type of news or hype. I don’t know what it is at this time but that is not important.

021607_lorenzo.png

JADE – Institutional Numbers:
Held by Institutions: 4%
Money Market: 9
Mutual Fund: 3
Other: 1

Top Holder: Portolan Capital Management, LLC
300k Shares for 0.32% of Portfolio
Total Equity Value of Portfolio: $281.0 million

A few Fundamental Numbers:
Market Cap.: $175mm
Outstanding Shares: 18.94mm
Short Ratio: 1.8
Operating Margin: 7.29%
Net Income $M: 87.98
ROA (%): 4.49%
ROE (%): 9.45%
P/E (TTM): 35.4
P/E (Forward): 23.12

Earnings:
Yearly (2006): 0.28E
Yearly (2005): 0.21
Yearly (2004): 0.22
Yearly (2003): 0.19
Yearly (2002): (0.90)

Revenue (millions):
Yearly (2005): 94.6
Yearly (2004): 77.4
Yearly (2003): 58.2
Yearly (2002): 39.2

Net Income:
2005: 3.06
2004: 2.69
2003: 1.81

BKC – Institutional Numbers:
Held by Institutions: 64.4%
Money Market: 68
Mutual Fund: 63
Other: 6

021607_king.jpg

Top Holder: Goldman Sachs Group Inc.
32mm Shares for 0.02% of Portfolio
Total Equity Value of Portfolio: $193.0 billion

A few Fundamental Numbers:
Market Cap.: $2.88bb
Outstanding Shares: 133.89mm
Short Ratio: 5.0
Operating Margin: 9.10%
Profit Margin: 2.63%
Net Income $M: 27.0
ROA (%): 4.99%
ROE (%): 9.59%
P/E (TTM): 48.8
P/E (Forward): 17.44

Quarterly Earnings Growth (yoy): 40.70%
Quarterly Revenue Growth (yoy): 9.20%

Enjoy!

021607_whopper.jpg

EDU Breakout on Huge Volume!

Stock of the Day – Update
New Oriental Education & Technology Group Inc.

020707_edu_weekly.png

Wednesday’s Closing Price: EDU – $40.80
Monday’s Closing Price: EDU – $36.93

Up 10.4% since writing the case study with a breakout today on volume 254% larger than the average. It traded more than 900k shares which crushed the average of 300k+.

020707_edu_daily.png

As I said yesterday (Institutions are pouring in):

I like when I see $227 million worth of shares purchased and 93 new institutional holders versus only $770 thousand worth of shares sold. This shows me major support and interest by the so called “smart-money”. The company sounds interesting and looks to have an excellent market (a description is below).

Held by Institutions: 13.10%
Money Market: 45 (42 new positions)
Mutual Fund: 51 (50 new positions)
Other: 1 (1 new position)

Shares Bought last Period: 6,313,271
Shares Sold last Period: 22,600
Value of Shares Bought: $227,073,203
Value of Shares Sold: $770,637

Learning about New Oriental Education (EDU)

Stock of the Day
New Oriental Education & Technology Group Inc.

Monday’s Closing Price: EDU – $36.93

Sector: Consumer Discretionary
Industry: Education Services

020607_edu_daily.png

Not a lot of data exists for the young Chinese stock so I wanted to take the time to focus on institutional holdings and the amount of shares that have been accumulated so far (the first reporting period). As you can see below, the majority of new institutional investors loaded up over the past couple of months and I suspect that it all started in November when volume surged and the price accelerated from $26 to $33.

The stock has since consolidated and traded sideway with support near $33 and at the 50-d moving average but is starting to trend higher (slowly). I don’t own shares as I write this report but I am looking to own shares within the next couple of weeks (could be as early as today). I am currently setting up my risk/reward strategy and calculating my stop loss and potential target area. I have limited data to calculate a realistic target but I do have enough to set up my sell stop and total risk.

I like when I see $227 million worth of shares purchased and 93 new institutional holders versus only $770 thousand worth of shares sold. This shows me major support and interest by the so called “smart-money”. The company sounds interesting and looks to have an excellent market (a description is below).

Held by Institutions: 13.10%
Money Market: 45 (42 new positions)
Mutual Fund: 51 (50 new positions)
Other: 1 (1 new position)

Top Holder: Massachusetts Financial Services Co.
1.3 mil Shares for < 0.01% of Portfolio Total Equity Value of Portfolio: $86.0 billion Shares Bought last Period: 6,313,271
Shares Sold last Period: 22,600
Value of Shares Bought: $227,073,203
Value of Shares Sold: $770,637

Key Fundamental Numbers (Yahoo Finance):
Market Cap (intraday): 1.36B
Enterprise Value (6-Feb-07): 1.17B
Trailing P/E (ttm, intraday): 58.62
Forward P/E (fye 31-May-08): 40.59
PEG Ratio (5 yr expected): 2.01
Price/Sales (ttm): 11.61
Price/Book (mrq): 6.38
Enterprise Value/Revenue (ttm): 9.96
Enterprise Value/EBITDA (ttm): 34.579
Profit Margin (ttm): 16.31%
Operating Margin (ttm): 17.42%
Total Cash (mrq): 149.93M
Total Cash Per Share (mrq): 4.057
Operating Cash Flow (ttm): 37.41M

Next Year Estimate: 0.75
Next Quarter: 0.06
Last Quarter: 0.03

Earnings:
Yearly (2006): 0.12

Revenue (millions):
Yearly (2006): 96.06

Net Income:
2006: 39.8

Cash Flow:
2006: 81.6

020607_edu_weekly_sm.png

About New Oriental
New Oriental is the largest provider of private educational services in China based on the number of program offerings, total student enrollments and geographic presence. New Oriental offers a wide range of educational programs, services and products consisting primarily of English and other foreign language training, test preparation courses for major admissions and assessment tests in the United States, the PRC and Commonwealth countries, primary and secondary school education, development and distribution of educational content, software and other technology, and online education. New Oriental’s ADSs, each of which represents four common shares, currently trade on the New York Stock Exchange under the symbol ”EDU.”

Net income for the six months ended November 30, 2006 was RMB173.3 million (US$22.1 million), representing a 135.7% increase year-over-year.

For the six months ended November 30, 2006 New Oriental reported net revenues of RMB598.4 million (US$76.4 million), representing a 31.8% increase year-over-year.

Digging for PetroChina (PTR)

Stock of the Day
PetroChina Co. Ltd.

Monday’s Intra-day Price: PTR – $123.38

I am going to stay on the China bandwagon with PetroChina, the leading company in that country with a broad range of petroleum-related activities, including: the exploration, development and production of crude oil and natural gas; refining, transportation, storage and marketing, including import and export, of crude oil and petroleum products; production and sale of chemical products; and the transmission, marketing and sale of natural gas.

020507_ptr_weekly_sm.png

Warren Buffet has more than a $1 billion stake in this company through Berkshire Hathaway and according to reports, holds more than 9 percent of the publicly traded shares. The reports I am referring to came out in 2003 (see monthly chart below), when PTR was trading much lower (showing why he is the greatest investor ever). It never hurts to have Buffet on your side!

PTR has been screened on the MSW daily screens several times over the past 12 months but it was never added to the MSW Index or placed in the portfolio. I can’t take credit for any of the gains over the past couple of years but I would like to be part of any gains that may take place in the future.

The stock is currently forming a consolidation pattern above the 200-d moving average, similar to the support it received three times over the past two years (see the chart). If the stock can maintain support, the current trading range will become the next buying opportunity. The recent declines were logged in as distribution but the stock was also catching support during those down-weeks.

Sector: Oils/Energy
Industry: Integrated Oil and Gas
52 Wk Range $89.85 – $142.60

Stat: Value of $10,000 invested five years ago: $86,982 today

Held by Institutions: 11%
Money Market: 202
Mutual Fund: 71
Other: 13
2.2 million more shares were bought then sold last reporting period.
This equaled a $300 million difference in money transfer to the positive side.

Top Holder: FMR Corporation (Fidelity Management & Research Corp.)
4.5 mil Shares for < 0.01% of Portfolio ($566 million value) Total Equity Value of Portfolio: $618.0 billion (more than half of $1 trillion) Key Fundamental Numbers:
Market Cap.: $21.8B
Outstanding Shares: 175.82M
Short Ratio: 2.20
Net Income $M: 17,036M
ROA (%): 19.7
ROE (%): 29.61
P/E (TTM): 13.4
P/E (Forward): 11.44
Price to Sales Ratio: 0.32
Price to Cash Flow: 1.27
Book Value per Share: 319.12
PEG Ratio: 0.70
Price to Book Ratio: 0.39
Cash Flow per Share: 96.89

3-Year Sales Rate: 30.89%
3-Year Net Income: 44.25%

020507_ptr_mthly.png

Earnings:
Estimated Earnings (2006): 10.93
Yearly (2005): 9.29
Yearly (2004): 7.13
Yearly (2003): 4.83
Yearly (2002): 3.26

Revenue (millions):
Yearly (2005): 552,229
Yearly (2004): 388,633
Yearly (2003): 303,779
Yearly (2002): 244,424

Net Income:
2005: 139,642
2004: 102,927
2003: 69,614

Cash Flow:
2005: 190,947
2004: 149,338
2003: 110,145

Is this just the beginning of the possible 10-bagger run or the top of the Chinese bust that some are talking about? I learn towards the former but will look for corrections to grab shares.