Said this on Friday about JADE in a post titled Bullion or Beef?:
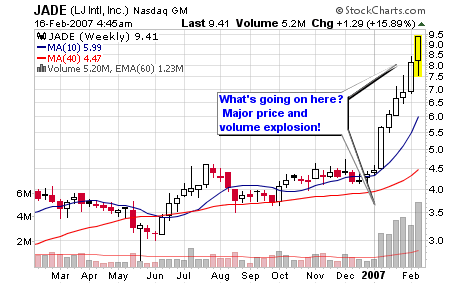
As for JADE, it’s a lower priced stock that I typically steer clear of but I can’t ignore the huge surge in price and volume over the past several weeks. The stock had doubled in price on volume 3-6 sixes greater than the average. It looks extended to the average investor and I am not jumping on at this point because the fundamentals don’t support the position but I am interested if the stock consolidates and offers an entry area. A stock with this much interest is going somewhere based off of some type of news or hype. I don’t know what it is at this time but that is not important.
A solid 19% gain this week on huge volume (2 days of trading). Again, I don’t own the stock for reasons explained but someone is accumulating on heavy volume and that interests me.
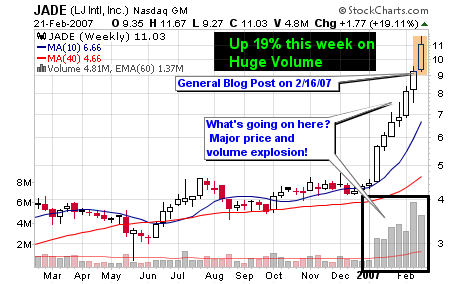
I don’t view the stock as a longer term investment at this time but I do see trade opportunities.


Connect with Me