Exploring Steel Momentum

Today’s notable stocks are listed at the bottom of this post!

“Trading momentum is paying-off in the current market environment. Swing trading breakouts making new highs on volume at least 100% larger than the average is king. It’s working so pay attention and be smart while putting on trades.”

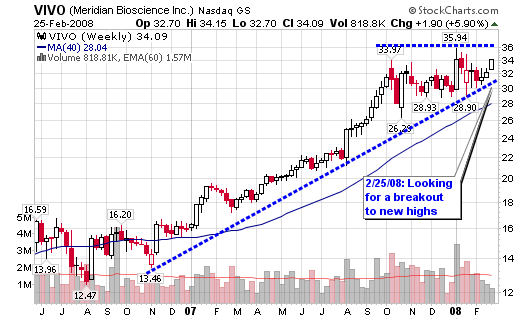
– This was a quote of mine on February 25, 2008 in a post titled Stocks Catching my Eye

030308_mtl_daily.png

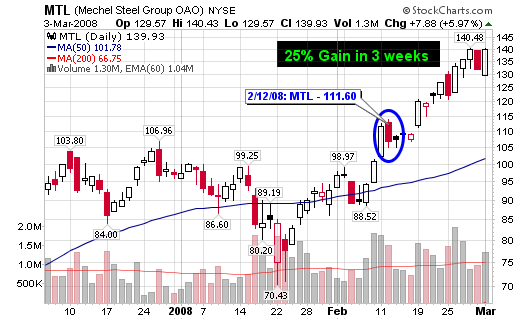
I profiled two new stocks, TITN and RIO, which haven’t made much of a move over the past week but MTL (mentioned as well – extended) was already up 15% in two weeks. The stock has added further gains for a 25% gain in three weeks.

  • MTL – 139.93, is now up more than 25% since my analysis on February 12, 2008. MTL first crossed a screen back on December 3, 2007 at $90.98 but I admit that I wasn’t looking to buy at that point (it was new to my screens).
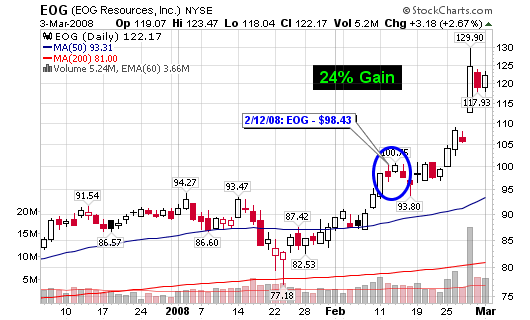
  • EOG – 118.04, was the second stock scanned on February 12, 2008 as it was up almost 5% on volume 112% larger than the average. The stock was just starting to break out to new highs while gaining nice momentum. It has gained more than 24% in three weeks while breaking out to new highs on above average volume.

The lesson: buying momentum, especially when a stock makes a new high on above average volume can be very profitable. What seems high to one investor can be low to another (precisely the case for MTL and EOG).

030308_eog_daily.png

Several other names from the February 12, 2008 blog post are also higher (in less than a month): SWN, RCC, NEU and KWK

Basic Materials (Oil) Stocks Making New Highs

MTL – 111.60, Mechel Steel Group was up 10.60% on volume 97% larger than the daily average

Stocks Catching my Eye: MTL – 126.83

Daily Screen for Monday 12-3-07

Interesting Stocks Making New Highs: MTL – 90.98

Basic Materials (Oil) Stocks Making New Highs

EOG – 98.43, EOG Resources was up 4.58% on volume 112% larger than the daily average

Other Notables Today:
[Read more…]

Gafisa SA (GFA)

Gafisa closed 8.35% off-of its all-time high Friday as the Dow Jones dropped 316 points (2.51%), the NASDAQ fell 60 points (2.58%) and the S&P joined the party by shedding 37 points (2.71%). Quarterly earnings are expected to be released Tuesday, March 4, 2008.

Fewer new positions were established than sold but $142.9 million more shares were purchased than sold during the last reporting period. However, things don’t look as rosy when searching through the financials as cash from operations and investments are sinking while cash from financing is increasing. Net income took a step back, earnings estimates look poised to drop but total revenue is increasing.

030208_gfa_wkly.png

I first started noticing GFA on my daily screens on December 3, 2008 at $37 and then profiled it again a week later on December 10, 2008.

GFA – 40.50, a spread triple top breakout on the P&F chart; the stock made a new high on the daily and weekly charts on above average volume (volume was 258% larger than the average on Friday). Screened last week at $37.00.

I read that Cramer has been pumping the stock so don’t buy the recent surge (sell to his sheep; short term), especially since the overall market is hurting. GFA is one stock that I will be looking to grab shares in if the market can show any strength in the future. Brazil has been going through a period of growth that is allowing the middle and lower class citizens to purchase homes which could lead to continued success for the company. In addition, billionaire entrepreneur Sam Zell owns 14% of the stock through his private equity firm.

Institutional Numbers:
Total Held by Institutions: 99
Money Market: 57
Mutual Fund: 40
Other: 2

New Positions: 23
Positions Sold: 30
Shares Held: 25.8M, +3.6M
Shares Held Previous Period: 22.2M

Shares Bought: 5.9M
Shares Sold: 2.3M
Value of Shares Bought: $233.6M
Value of Shares Sold: $90.7M

030208_gfa_daily.png

[Read more…]

Listen to My Audio Interview

As promised, the audio version of my Trader Interview with Tim Bourquin is now loaded in the widget below. The interview lasts about 20 minutes covering topics such as how/ when I started trading, the types of fundamental screens I use each night and the four of charts I study for each stock I research.

The interview can also be heard on the Trader Interview website or this direct permalink using Windows media, RealPlayer, mp3 stream or direct link to mp3. My favorite place to listen is on my iTouch using iTunes, by subscribing to the free Trader Interviews podcast.

Enjoy and certainly let me know what you think!

Show notes: Chris Perruna is a part-time trader who holds positions from three to nine months at a time, looking for larger moves in stocks he chooses based on the CANSLIM method from Investor’s Business Daily. Here we talk about the three stock screens he uses each night, why he likes stocks that are about to bounce off their 200-day moving average and why he, even though he is a longer-term trader, will get out of a position the same day if the trade isn’t working out. Chris’ blog can be found at: ChrisPerruna.com.

022808_chris_dance.png

Is Big Blue Back (IBM)

We all know IBM gave investors an excellent return last year versus previous years but can the stock continue to move higher. Is this the new and improved sustainable Big Blue?

022608_ibm_wkly.png

International Business Machines (IBM) has been making some of its largest gains of the past ten years, starting at the end of 2006. Not since the late 1990’s has the stock enjoyed this type of run with volume support which translates into a positive accumulation/ distribution rating.

IBM went from a split adjusted price of $9.67 in 1993 to $132.52 at its peak in the 1999 bull market. It corrected to $51.77 in 2002 before trading sideways for the next four years. Something clicked in late 2006 and the stock ran-up from $70 to a high of $120.57.

IBM closed at $114.38 Tuesday night, a 5.84% gain on volume 98% larger than the average. The stock crossed back above the 40-week (200-d) moving average while also jumping back above the shorter term 50-d moving average. An ascending triple top breakout has also flashed on the point and figure chart.

Next stop: Is it a new multi-decade high which signals a buy?

Institutional Numbers:
Total Held by Institutions: 2,947
Money Market: 1,357
Mutual Fund: 1,472
Other: 118

New Positions: 288
Positions Sold: 125
Shares Held: 1.26 Bil
Shares Held Previous Period: 1.23 Bil

Shares Bought: 116.2 Mil
Shares Sold: 89.5 Mil
Value of Shares Bought: $12.14 Bil
Value of Shares Sold: $9.36 Bil

26.7 million new shares have been bought (versus sold)
$2.8 billion new dollars have flowed into the stock

So what does IBM do these days?
IBM’s business comprises three principal business segments: Systems and Financing, Software and Services.

[Read more…]

Daily Screen for Tuesday 2-26-08

My fundamental screens are limited but I like it that way so I can concentrate on the stocks that are moving higher on above average volume. Only three stocks of interest made my final nightly screen tonight as was the case last night. Tonight’s stocks are all within 15% on new highs and moved higher on volume at least 50% larger than the 50-day average.

022508_vivo_wkly.png

022508_vivo_daily.png

  • VIVO – 34.09, the stock was up 5.90% on volume 126% larger than the 50-day average. The stock is building an up-trending wedge that looks ready to challenge new multi-year highs. A move above $36 on heavy volume will be positive.
  • CEDC – 56.25, the 2007 superstar is currently building support and resistance levels between $45 and $61 as it looks to make new highs. A move above $61 on above average volume will qualify the stock as a possible $60-$100 candidate. This type of move will also reestablish its position as a market leader in 2008.
  • FSCX – 46.91, the stock was up 6.86% today on volume 62% larger than the 50-d average as it looks to challenge all-time highs. I have been following FCStone since last May (2007), prior to the 3:2 stock split (up 52% since that June 4, 2007 post titled FCStone Group Inc. (FCSX). It has had some ups and downs since my analysis but may finally be ready to make the true up-trend I felt it was capable of making.

As you will notice, tonight’s stocks are very similar to last night’s stocks (TITN, RIO and MTL) as they are moving higher (new 52-week highs) on above average volume: momentum plays.

[Read more…]